King Tides: A cosmic phenomenon
What is a king tide?
The term king tide is generally used to describe the highest tides of the year. Tides are caused by the gravitational forces of the moon and the sun. Even though both the sun and moon influence our tides, the moon’s gravitational pull is about twice as strong than that of the sun. Therefore, we experience different tidal forces as a result of how far away the sun, moon, and earth respectively are from each other. When the earth, moon, and sun are near alignment we get a new moon (moon between the sun and earth) and full moon (earth between the moon and sun). This alignment causes an increase in the gravitational pull roughly twice a month called ‘spring tides’. The moon’s closest position to the earth is called a ‘perigee.’ When a full or new moon coincides with perigee we get perigean spring tides. These are slightly larger tidal events that happen about three or four times a year.

Perigean spring tide diagram courtesy of NOAA Ocean Service
When are the king tides for the 2023/2024 Winter?
This year King Tides are December 12-14, 2023, January 11-12, 2024, and February 9-10, 2024
Below is the tide predictions for Scripps Institution of Oceanography Pier in La Jolla, CA for the December 2023, January 2024, and February 2024 King Tides.
| Date | Day of Week |
Time |
Height (ft) |
High or Low |
|---|---|---|---|---|
| 2023/12/12 | Tue | 7:48 AM | 6.8 |
H |
|
2023/12/12 |
Tue | 3:10 PM | -1.1 | L |
|
2023/12/13 |
Wed | 8:25 PM | 6.9 | H |
|
2023/12/13 |
Wed | 3:58 PM | -1.2 | L |
|
2023/12/14 |
Thur | 9:05 AM | 6.9 | H |
| 2023/12/14 | Thur | 4:38 PM | -1.2 | L |
| 2024/1/11 | Thur | 8:20 AM | 7.2 | H |
| 2024/1/11 | Thur | 3:41 PM | -1.7 | L |
| 2024/1/12 | Fri | 9:04 AM | 7.2 | H |
|
2024/1/12 |
Fri | 4:21 PM | -1.7 | L |
|
2024/2/9 |
Fri | 8:14 AM | 7.1 | H |
|
2024/2/9 |
Fri | 3:18 PM | -1.8 | L |
|
2024/2/10 |
Sat | 8:58 AM | 7 | H |
|
2024/2/10 |
Sat | 3:53 PM | -1.7 | L |
Why is there interest in going to the coast during king tides?
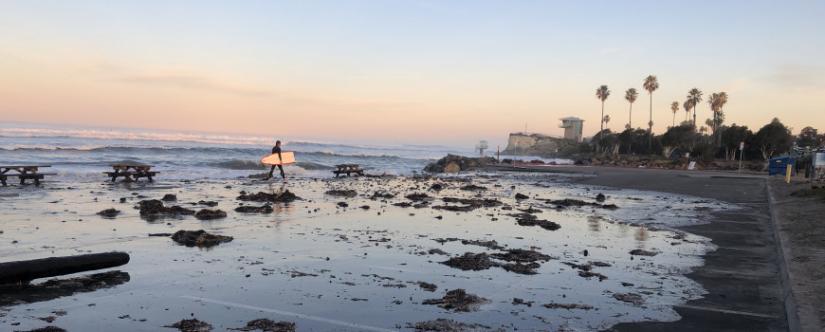
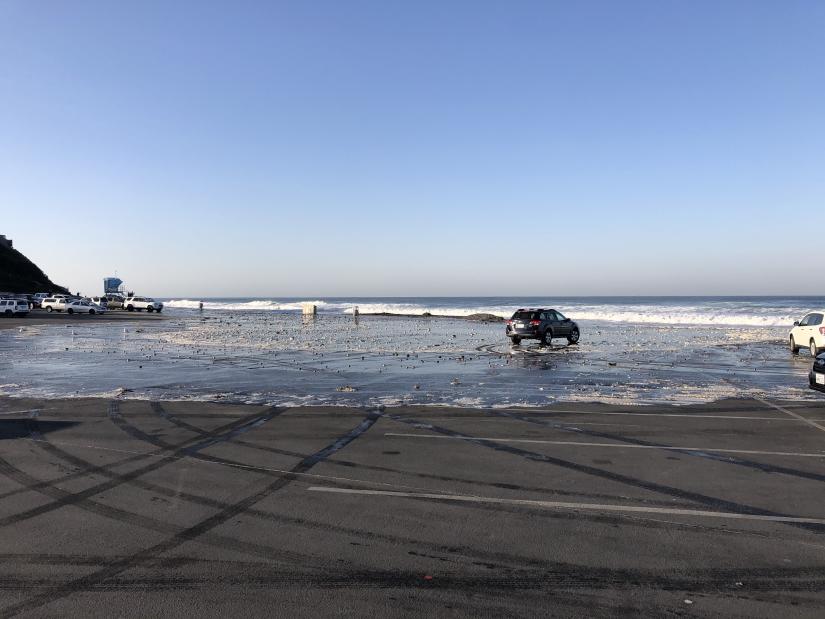
The California coast is a dance of dynamic forces: waves, wind, rivers, rain, tectonic activity, and the engineering of human development. King tides provide a great opportunity to get a glimpse of what our coast may look like as sea-level rises. The water level reached by an extreme high tide today will be the same water level of more frequent moderate tides in the future. Seeing what areas flood during these events can help us plan for the future.
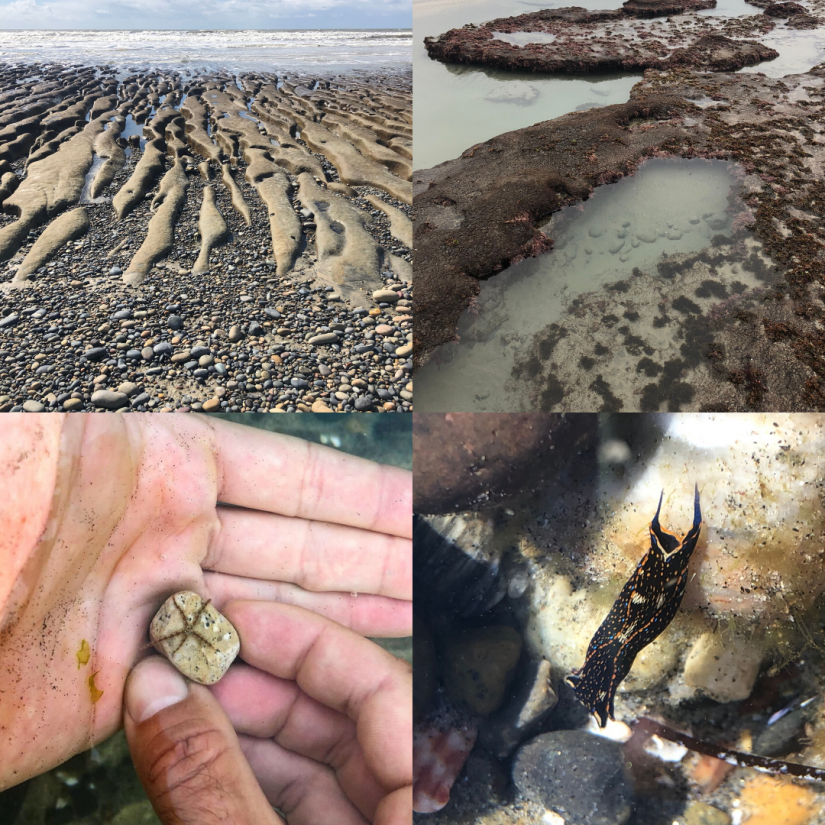
King tide surprise bonus:
Most tides in California are mixed semidiurnal. That means we typically get two high and two low tides in a 24-hr period. Because of this, not only does the king tide bring extreme high water levels, we also get very low tides. Roughly seven hours after the peak high tide, beach goers can see the splendor of tidepools, critters, and coast that typically remains hidden to those of us without gills.
How can I get involved?
To broaden public awareness in an effort to bolster more stakeholder input on coastal hazards the California King Tides Project is a community science program managed by the California Coastal Commission that is focused on highlighting this coastal phenomenon. This statewide effort partners with many organizations to promote a unified platform for collecting photos of king tides from around California. Photos can be uploaded via a web browser or free Survey123 app (Apple Store | Google Play) to the California King Tides Project platform can be viewed on a story map to help share how tides play out across California. Learn how to upload your photos here.
A list of California King Tide events are available here.
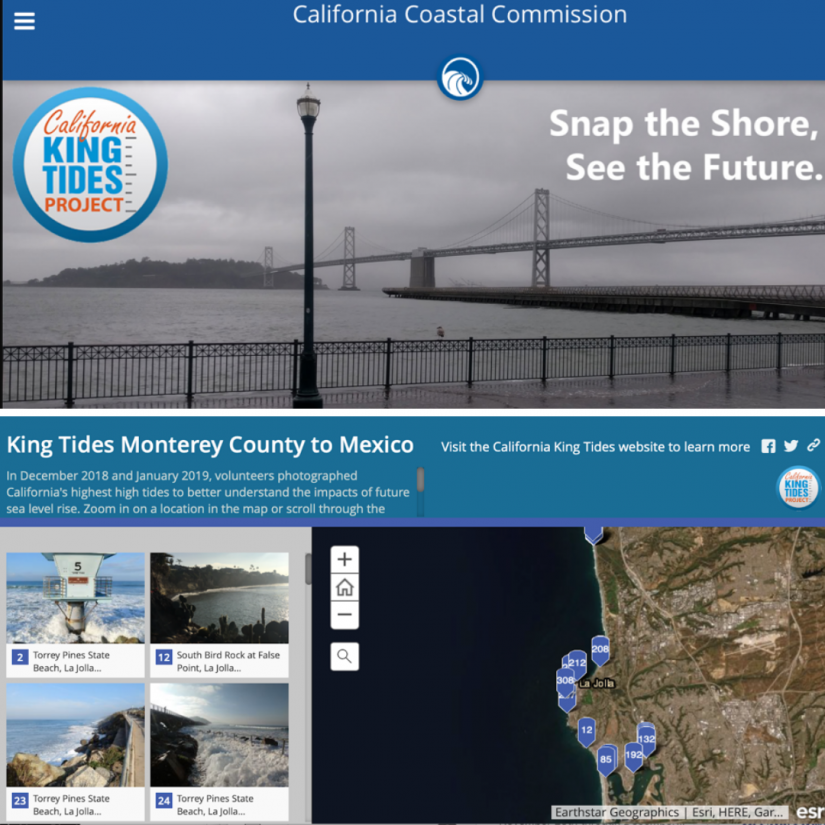
California King Tides Project
Is there other coastal monitoring volunteer opportunities?
Community Alliance for Surveying the Topography of Sandy Beaches (CoAST SB) is another California Sea Grant project that enables volunteers to survey beaches in Ventura and Santa Barbara counties each month. Trained volunteers measure the beach profile, the surface contour of the beach, to track physical changes to the beach on seasonal, annual and longer timescales. The monthly data is shared with the US Geological Survey to help calibrate their models. To learn more, please see the CoAST SB web page.
Do king tides always mean flooding?
The short answer is no. Although the elevated water levels of king tides and perigean spring tides increase the likelihood of flooding, a large majority of coastal damage in California comes from when swell (i.e. wave) and/or storm (i.e. rain) events coincide with moderate to high tides. Keeping track of tides, monitoring beaches, and forecasting swell events allows managers to better understand what assets are vulnerable to sea-level rise to help plan adaptation strategies to preserve coastal resources. For example, The Center for Climate Change Impacts and Adaptation is working with Imperial Beach to help forecast flood events and increase coastal resilience - often these flood events happen when king tides are combined with large swell. Coastal access however does get impaired with elevated water levels, such as happens with king tides. Understanding how access to our beaches will be lost with rising sea-levels is an important question for coastal managers.
Are tides the same up and down California?
Because the earth is not a perfect sphere and has continents scattered across the surface, tidal regimes are not equal across the planet and vary across California’s vast coastline. In particular, bays and estuaries can experience very different timing and fluctuations of tides based upon the basin shape and mouth that connects them to the ocean.
Where can I find tide predictions for my beach?
Tides are one of the most consistent oceanographic parameter scientists can predict. The National Oceanic and Atmospheric Administration (NOAA) maintains a great website to find the tide predictions and observations closest to you.
Find your nearest tide station here!
Swell and waves are also critical when thinking about coastal resources, vulnerabilities, and beach dynamics. Current wave conditions as well as short term wave forecasts are available for your area from the Coastal Data Information Portal (CDIP).
For longer term forecasts, NOAA’s GFS-Wave model viewer can provide you information on upcoming swells.
Check out the CCCIA project that combines tide and wave forecasts and observations for Imperial Beach, CA here.
What events are going on that I can attend?
While in previous years events have been organized, due to physical distancing guidance, we are not encouraging gatherings. Instead individuals or members of the same household are encouraged to go to the coast to see either the elevated water levels or very low tides that come with the King Tides. This site will be updated as virtual events are scheduled.
A list of California King Tide events are available here. To get updates, sign up for California Sea Grant's newsletter here.