Statewide commercial fishery activity
Commercial fishery activity – how much fish and shellfish is caught and brought to port (landed), what it’s worth, and how many people and businesses are involved – varies throughout the state, during the year, and from year to year. Exploring fishery landings data – information on landings and the amount paid to fishermen at the docks (‘ex-vessel value’) – can provide a general sense of fishery activity in California (see Measuring commercial fishing activity). Here we provide some general information on those measures over time, the state’s top fisheries, and a snapshot of how landings are distributed among the state’s coastal regions. Visit the region pages of this website to learn more about the fishery activity in each of the state’s five coastal regions.
California commercial fishing activity since 2000
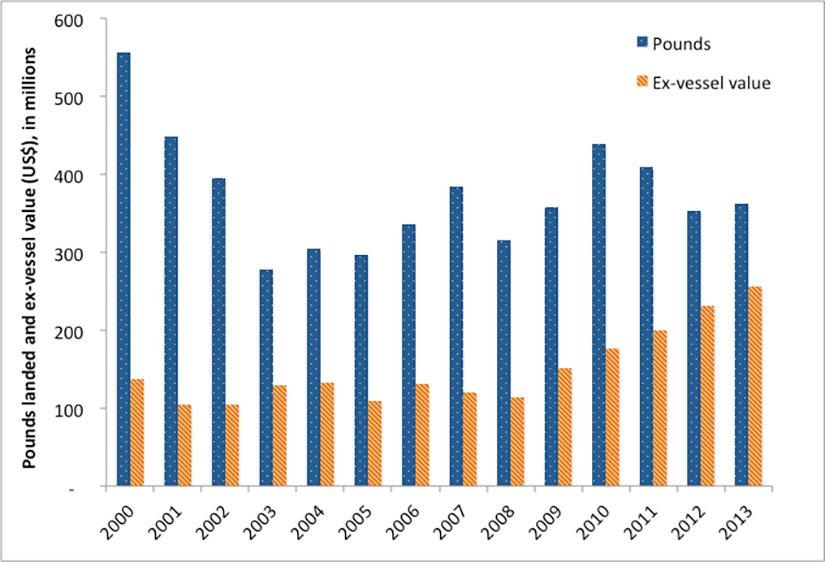
Fishing activity in California has changed over time largely due to increased regulation (to conserve resources) and environmental, social and economic factors, with a general downsizing of fisheries occurring over the past few decades. Focusing on the period since 2000, fishing activity has varied, with the following averages and extremes for the years 2000-2013. (Ex-vessel values are not adjusted for inflation.)
- Average (2000-2013): 374 million pounds, worth $150 million per year
- Highest poundage (2000): 557 million pounds worth $138 million
- Highest value (2013): $256 million, with 363million pounds landed
- Lowest poundage (2003): 278 million pounds, worth $129 million
- Lowest value (2001): $104 million, with 448 million pounds landed
For any given year, landings and value reflect the particular mix of species landed and the price per pound, both of which vary for many reasons. Fisheries are sometimes described by these two measures, being referred to as high-volume/low price-per-pound (e.g., squid, sardine) or low-volume/high price-per-pound (e.g., lobster, spot prawn).
Top fisheries statewide (2013)
Historically, the waters off California have supported a great variety of fisheries, for both finfish and shellfish. In 2013, commercial fishermen landed more than 363 million pounds (165,000 metric tons) of seafood at California’s coastal ports with an ex-vessel value of nearly $256 million. The top fisheries (species-gear combinations; in alphabetical order) with the most pounds landed and highest ex-vessel value (with some fisheries occurring in both categories) included:
| Ex-vessel value (≥ $10 million each) | Pounds landed (≥ 13 million pounds each) |
|---|---|
| California spiny lobster | Coastal pelagic finfish (sardine, anchovy, mackerel) |
| Chinook salmon | Dungeness crab |
| Dungeness crab | Groundfish |
| Market squid | Market squid |
| Red sea urchin | Red sea urchin |
Regional contributions to state landings
Fishing activity varies within and among the state’s five coastal regions, and is a function of the:
- Distribution of the species
- Ocean environment
- Management context
- Port infrastructure and amenities
- Market demand and availability of buyers
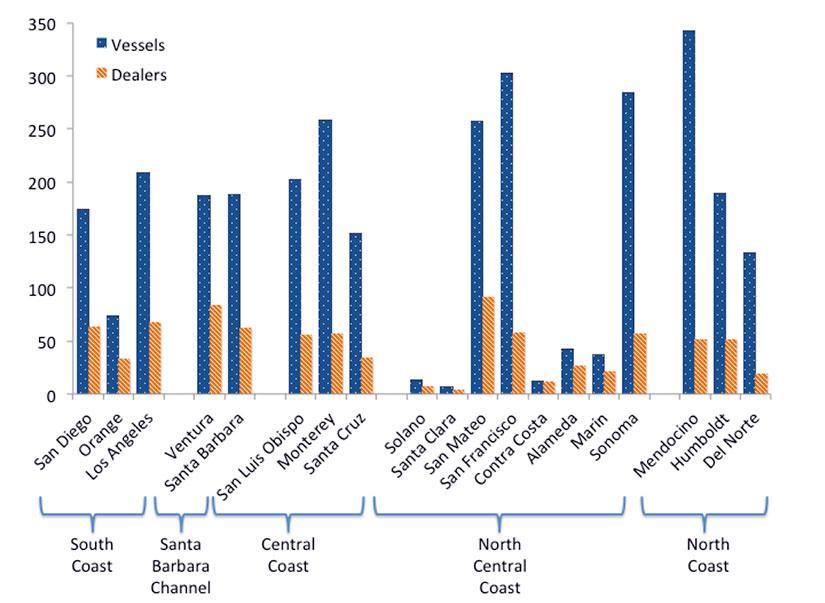
In 2012 (2013 data were not yet publicly available), about 1,900 commercial fishing vessels landed catch at California ports, with some 480 dealers buying and distributing the catch. Dealers include fishermen selling their own catch directly to the public, restaurants and grocers, as well as dedicated fish buyers (some of which also process the catch). As shown in the figure below, Mendocino, Monterey and Los Angeles counties had the greatest numbers of vessels with landings at their ports, whereas San Mateo, Ventura and Los Angeles counties had the greatest numbers of dealers.
California commercial fishery landings
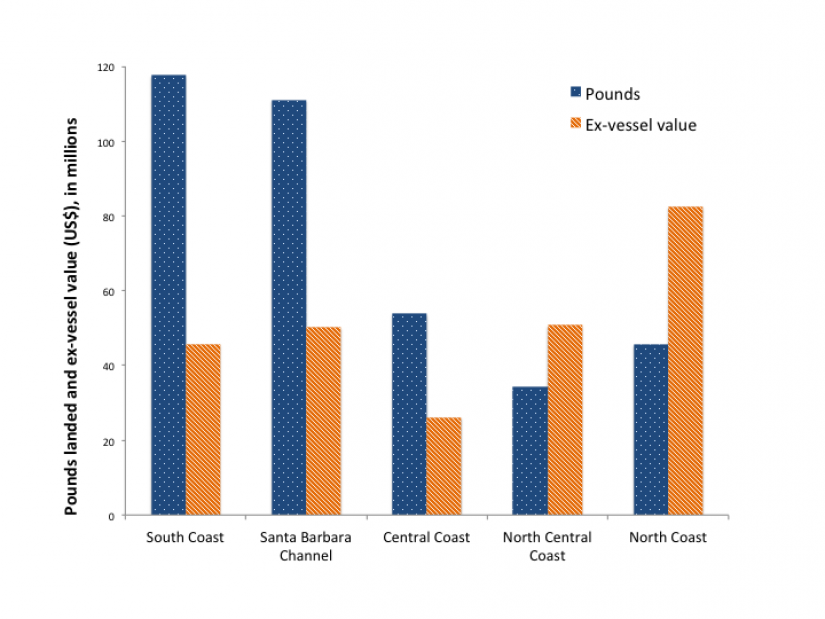
In 2013, landings (by weight) were concentrated in the more southerly regions of the state, while ex-vessel value was highest for the North Coast region (see chart below). These patterns were largely due to high landings of squid in the south (Los Angeles and Ventura counties), and the high ex-vessel value of Dungeness crab landings in the north (Humboldt and Del Norte counties).
These landings data are influenced by the combination of fisheries and markets in those areas. For example, the high-volume/low price-per-pound coastal pelagic species fisheries (for squid, sardine, mackerel and anchovy) are particularly active in the South Coast and Santa Barbara Channel regions, and moderately active in the Central Coast region. And although considerably less seafood is landed in the North Central Coast region, its fisheries include higher price-per-pound species such as Dungeness crab and Chinook (king) salmon, among others. Visit the North Coast, North Central Coast, Central Coast, Santa Barbara Channel, and South Coast.pages for more details about fishing activity there.
Information sources
Leet, W.S., Dewees, C.M., Klingbeil, R. and E.J. Larson. (2001). California's Living Marine Resources: A Status Report. 4th ed. Sacramento, CA: CDFG, 562 pp.