Measuring commercial fishery activity
How is commercial fishery activity measured?
Commercial fishery activity happens both on the water, as fishermen target and catch marine species, and onshore, through the offloading, processing and distribution of seafood. The California Department of Fish and Wildlife (CDFW), together with the Pacific States Marine Fisheries Commission (PSMFC) and the National Marine Fisheries Service (NMFS), track this activity in several ways:
- Fish tickets/landings receipts
-
for each fishing trips, fishermen are required to report several types of information including the species and amounts (in pounds) landed, the amount paid to the fisherman for the catch, the gear used, area fished, place and date of landing, and the name of the vessel, skipper, and receiver (i.e., the shoreside fish-buying business or, if selling directly to the consumer, the fisherman).
- Vessel logbooks
-
for several fisheries (e.g., sea urchin, lobster, swordfish), fishermen record additional catch information such as the number of legal-sized individuals retained and the number of ‘shorts’ (under the size limit) returned to sea, the areas fished, and amount of gear used (e.g., number of traps pulled).
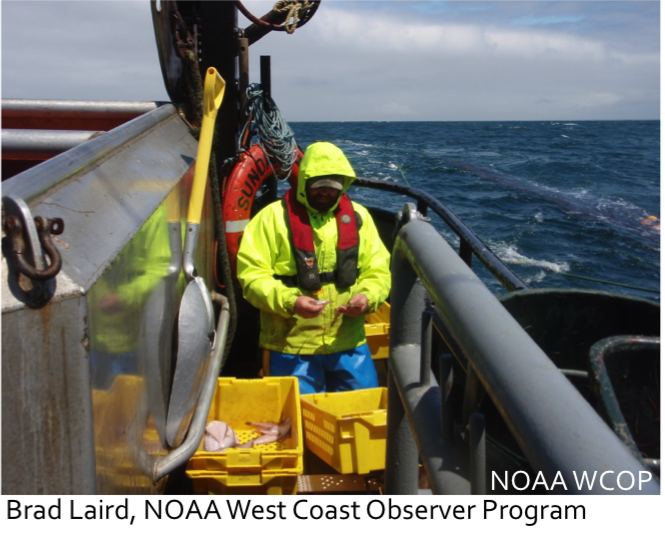
- Onboard observers
-
for certain fisheries (e.g., groundfish trawl, swordfish drift gillnet), onboard federal observers are required for some or all commercial fishing trips. They collect data on samples of the catch, effort (e.g., number and length of trawl tows), animals discarded (for economic or regulatory reasons), and encounters with marine mammals, seabirds and sea turtles.
- Port sampling
-
through a partnership between CDFW and PSMFC, agency personnel regularly collect data (e.g., species, sex, length, weight) on samples of the catch for several fisheries (e.g., groundfish, California halibut). These additional ‘fishery-dependent’ data support the estimation of population characteristics (e.g., age distribution, sex ratios), which in turn are used by fishery managers.
A fish ticket (or landings receipt) is completed each time a fisherman sells his catch – to a dockside buyer, a restaurant, or directly to a consumer. This information is entered into a database maintained by CDFW that allows both state and federal agency staff to analyze trends in a fishery to inform and evaluate fishery management. For some fisheries, the landings data are supplemented with logbook, observer and/or port sampling data, which are incorporated into fishery analyses and management. (As described in the next section, some landings data are available to the public.)
How are fisheries data used?
Fisheries data are analyzed to determine whether a fishery is stable, recovering, or requiring rebuilding, and appropriate management actions are developed and implemented. In some cases, data are reviewed periodically (usually annually or bi-annually) and regulations are updated as needed. In other cases, such as quota-managed fisheries (e.g., sardines, squid, groundfish) or where stocks are rebuilding (as for a small number of West Coast groundfish species), in-season management may be used. This means that landings are monitored in ‘real time’ during the season, and when the quota is reached, the fishery is closed.
Interpreting fishery landings data
Fishery landings data are not a direct measure of species abundance, as they are influenced by several factors:
- Species abundance
- Environmental conditions
- Regulations
- Economic conditions
Fishing activity can increase or decrease as the abundance or quality of product changes in association with weather events and other environmental conditions (e.g., the availability of prey species or increase of predators); as the economy and demand fluctuate with strengthening and weakening prices and the amount spent by consumers; and with changes in regulations such as limits on the number of permits, fishing days or the amount of fish that can be caught.
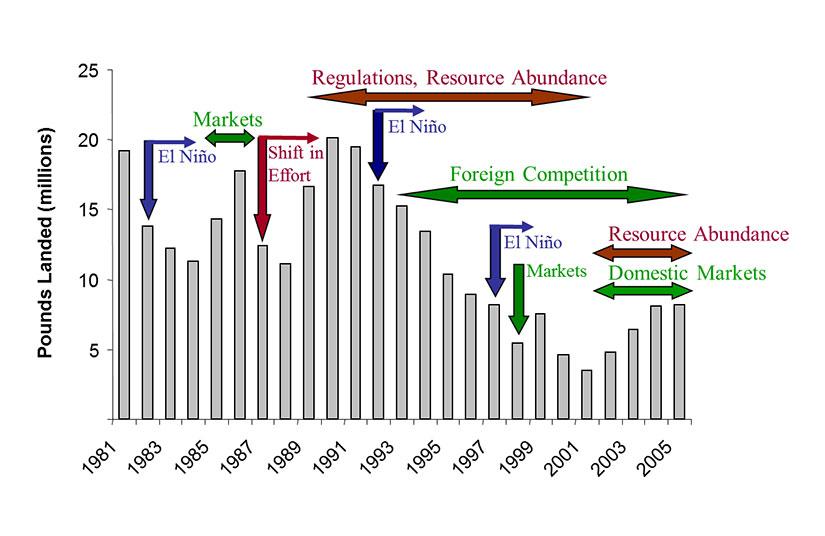
The annotated chart of the Santa Barbara Channel sea urchin fishery below shows how several different factors have influenced landings in the fishery over time. The arrows pointing down indicate years when identifiable events occurred, and the arrows pointing left and right indicate a multi-year period when the fishery was influenced by a specific event or circumstance. (Long-term effects are not included.) In the 1980s and 1990s, this was the most valuable fishery in California. Since then, however, activity in the fishery has declined due to several factors including: 1) environmental conditions (e.g., El Niño events, which reduce the abundance and quality of kelp, their food source), 2) lower abundance of animals, 3) newly implemented regulatory restrictions (e.g., reducing the number of permitted divers from 900 to 300), 4) a weakened Japanese economy (i.e., leading to decreased demand), and 5) increased competition from sea urchin producers in other countries (e.g., Russia).
Publicly available data
You, too, can explore fisheries landings data through certain websites. Just keep in mind what we have described here: while decreases in fishery activity may reflect decreases in species abundance, it is critical to consider other factors as well when interpreting landings data as they often are major factors influencing fishing activity (with resource abundance playing little or no role in those trends). This is particularly true in California as many new regulations, including restricted access (limited entry), quotas, and time and area closures have been implemented, especially since the mid 1990s, resulting in the downsizing of many California fisheries.
Also, while the above chart examines trends in the volume (pounds) landed, one can explore changes in the value of the fishery over time using landings data. However, similar factors influence the value and volume of a fishery and should be considered when interpreting these data.
With all of this in mind, we encourage you to explore the publically available California landings data – both the amount and value landed for each fishery – through the CDFW website. Landings from 2000 through the most recent calendar year (by June the following year) are reported annually by port, region and statewide. (The PSMFC’s Pacific Fisheries Information Network (PacFIN) database also archives these data and a variety of data summaries for Washington and Oregon as well as California, and the NMFS maintains a searchable commercial fisheries statistics website.)
Information sources
CDFW Commercial Landings Information
NMFS Commercial Fisheries Statistics
Pacific States Marine Fisheries Commission (PSMFC) Pacific Fisheries Information Network (PacFIN)