Breadcrumb
- California Offshore Winds
- Energy Demand and Goals
Energy Demand and Goals
- How much energy does California use?
California has an approximate population of 38.9 million residents and 14.28 million housing units. In 2021, California per capita consumed the 48th most energy out of the 50 states and Washington D.C. This number is relatively high because the majority of energy is used by commercial and industrial users. In 2021 residential electric consumers used 35 percent of the energy produced in the sector, commercial users used 45 percent and industrial users used 19%.
In 2022, California’s electricity generation increased 3.4% from 2021 to 287,220 GWh. Utility-scale renewable energy increased 10.2% from 2021 to 102,853 GWh. In March 2021, California was using 80.7 GW of power.
- Where does California source its energy from?
In 2022, California’s current largest source of in-state energy for electric generation was natural gas (accounting for 47.48% of in-state generation). Solar accounts for 19.92% of in-state generation followed by nuclear (8.67%), large hydro (7.19%), wind (6.86%), geothermal (5.47%), biomass (2.64%), small hydro (1.48%), and other sources amounting to less than 1%.
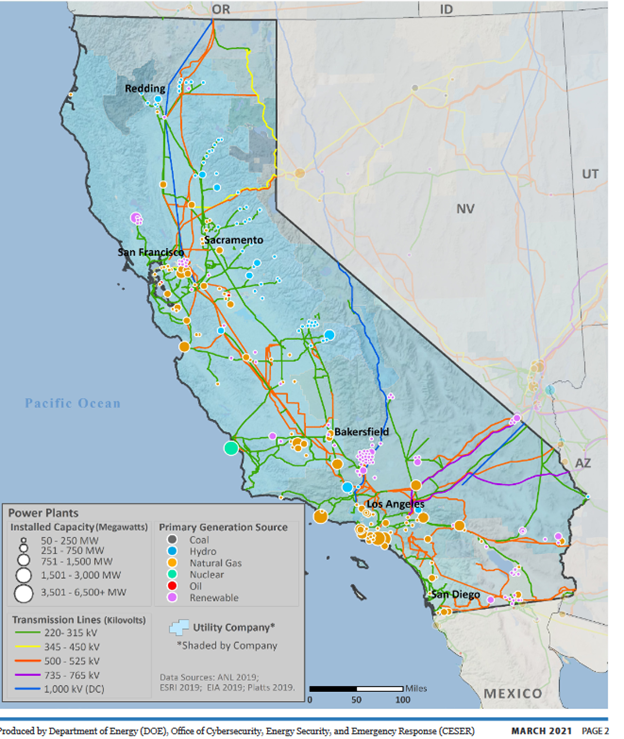
2021- Breakdown of 80.7 GW of Annual Total Electric Production Capacity (1)
Natural Gas 312 plants 40.2 GW
Wind & Solar 712 plants 19 GW
Hydroelectric 251 plants 10.1 GW
Other sources 206 plants 8.6 GW
Nuclear 1 plant 2.2 GW
Petroleum `19 plants 0.6 GW
Coal 1 plant 0.1 GW
Image
With out-of-state imports added to California’s in-state generation, there is both additional renewable energy and more coal in California’s power mix.
2022-California Total System Electric Generation’s Power Mix (including energy imports)
Natural Gas- 36.38%
Solar 17.04%
Wind 10.83%
Large Hydro 9.24%
Nuclear 9.18%
Geothermal 4.67%
Coal 2.15%
Biomass 2.15%
Small Hydro 1.12%
California uses 22% of its available natural gas for electric power, 39% for industrial uses, 13% for commercial uses, and 22% for residential uses.
- What is California’s commitment to making a transition to renewable energy?
California committed in SB 100 2018 to a renewable goal of 60 percent renewables by 2030 and 100 percent of retail sales and state loads renewable zero carbon energy by 2045. These goals were further delineated by SB 1020, the Clean Energy, Jobs and Affordability Act of 2022, with interim goals of 90% zero energy retail sales and state load sales by 2035 and 95% by 2040.
To reach this goal, California plans to produce 188 GW of energy, more than twice its current production. California intends to maintain its geothermal production and significantly expand its access to utility-scale solar, customer solar, battery storage and onshore wind (mostly from out-of state production). California also plans to create new energy resources in the form of offshore wind. Modeling suggests the need for California to create 6GW of clean energy annually from 2020-2045 to meet its 2045 clean-energy goals which may include 25 GW of offshore wind. The current BOEM leases provide 4.6 GW of offshore wind. From 2013-2023, California built 1 GW of utility solar and 0.3 GW of wind per year.
California Approximately 188 GW of Power Capacity for 2045 (2)
Solar Utility Scale 69.6 GW
Storage Battery 48.8 GW
Solar Customer 28.2 GWWind Offshore 25 GW
Wind Onshore 12.5 GW
Storage Long Duration 4 GW
Geothermal .01 GW
California has a Renewables Portfolio Standard (Senate Bill X1-2) from 2011 requiring California electricity load-serving entities to increase purchases of eligible renewable energy (solar, wind, geothermal, biomass, and small-scale hydroelectric) to 33% of retail sales by 2020 and 60% by 2030. As of 2022, California’s in-state energy generation for eligible renewables standards at 36.37%.
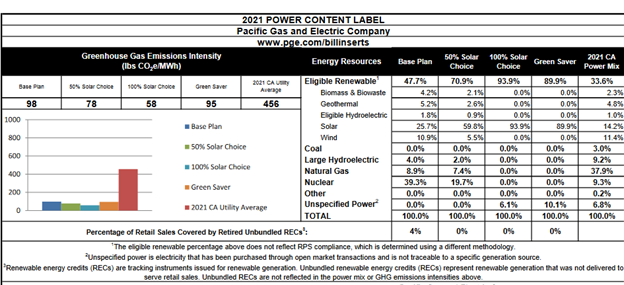
Each county contributes energy to the Renewables Portfolio Standard. San Luis Obispo County in 2020 generated 2,649 GWh of solar energy. Kern County generates the most wind in the state with 7496 GWh. SB 1305 from 1997 requires that utilities provide a “power source disclosure” to citizens to indicate sources of energy used to provide electric service.
This is an example of a 2021 Power Content Label from Pacific Gas and Electric Company which services San Luis Obispo County. For other examples of power content labels, please visit https://www.energy.ca.gov/programs-and-topics/programs/power-source-disclosure/power-content-label/annual-power-content-2
Image
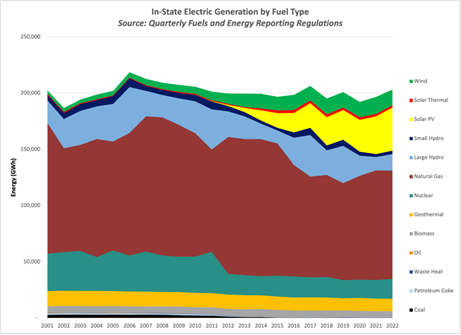
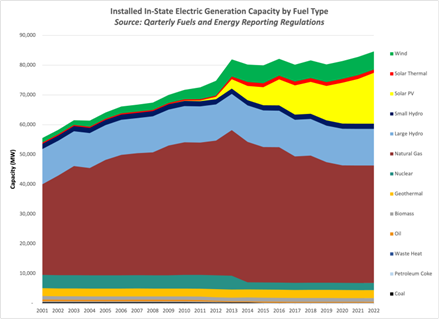
The following charts illustrate trends in fuel sources for in-state fuel sources. Overtime, the in-state electric nameplate generation for wind (2011 7,598 GWh to 2022 13,938 GWh) and installed in-state electric generation nameplate capacity for wind (2011 3992 GWh to 2022 6117 GWh) from 1MW or larger powerplants in California have both grown. These charts do not include data from distributed generation from residential installations or imported energy. Wind is an increasing part of California’s transition to renewable energy sources but is not the dominant source.
Electric Generation by Fuel Type (3)
Image
Electric Generation Capacity by Fuel Type (4)
Image
- References
- https://www.energy.gov/sites/default/files/2021-09/California%20Energy%20Sector%20Risk%20Profile.pdf
- https://www.energy.ca.gov/publications/2021/2021-sb-100-joint-agency-report-achieving-100-percent-clean-electricity
- https://www.energy.ca.gov/data-reports/energy-almanac/california-electricity-data/electric-generation-capacity-and-energy
- https://www.energy.ca.gov/data-reports/energy-almanac/california-electricity-data/electric-generation-capacity-and-energy