N/A


The Changing Coast
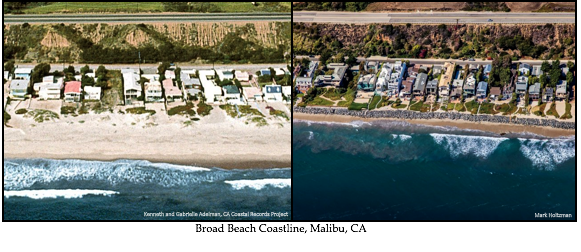
The California coastline is changing due to climate change and sea-level rise. Recent science tells us that sea levels are projected to rise rapidly over the course of this century, and we need to protect our bay and coastal communities and habitats because, if we don’t, there will be catastrophic consequences if left unaddressed.
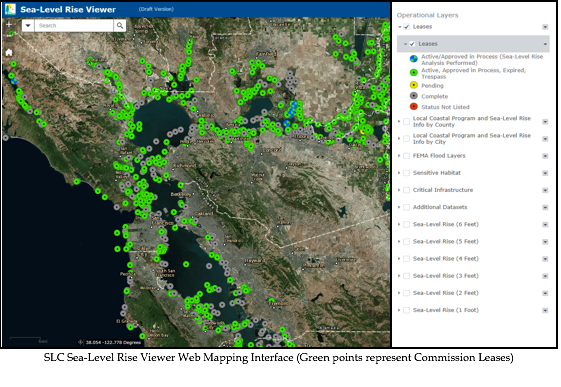
The State Lands Commission (SLC) is working hard to address sea-level rise by integrating climate change and sea-level rise into all planning and decision-making. To support the Commission’s efforts in addressing sea-level rise, I developed a web-mapping application called the Sea-Level Rise Viewer. The Sea-Level Rise Viewer is an interactive visualization tool that enhances the ability of Commission staff to make more informed, data-driven decisions about long‐term planning and management of critical resources along the coast.
It All Began With a Map
The road to developing a meaningful web-mapping application for my host Agency was a four month journey of learning the ins and outs of how the Commission addresses sea-level rise. It was clear that utilizing my technical background in Geographic Information Systems (GIS) was the correct approach because GIS engages and inspires people to discover their world through the use of maps, especially web maps. Web maps are the framework for building effective web-mapping applications.
A great map doesn’t happen overnight. You have to put a little bit of yourself into it, like a great resume. A great map needs great data, and that requires a strategic vision. By focusing on Agency workflows, I began to understand the different processes involved in their efforts to address sea-level rise and slowly created a vision for the Mapping Viewer. With support from my supervisor, we decided that a critical workflow was to focus on the process by which staff analyzes a lease application for sea-level rise vulnerability. To replace an existing workflow with a new and improved process, I began asking myself: What value can I add? Who are the users? What information would be relevant? And, what are the priorities? Over time, the Mapping Viewer evolved into a core information and communication tool with multiple capabilities, like:
- Visualizing and comparing potential future sea-level rise scenarios
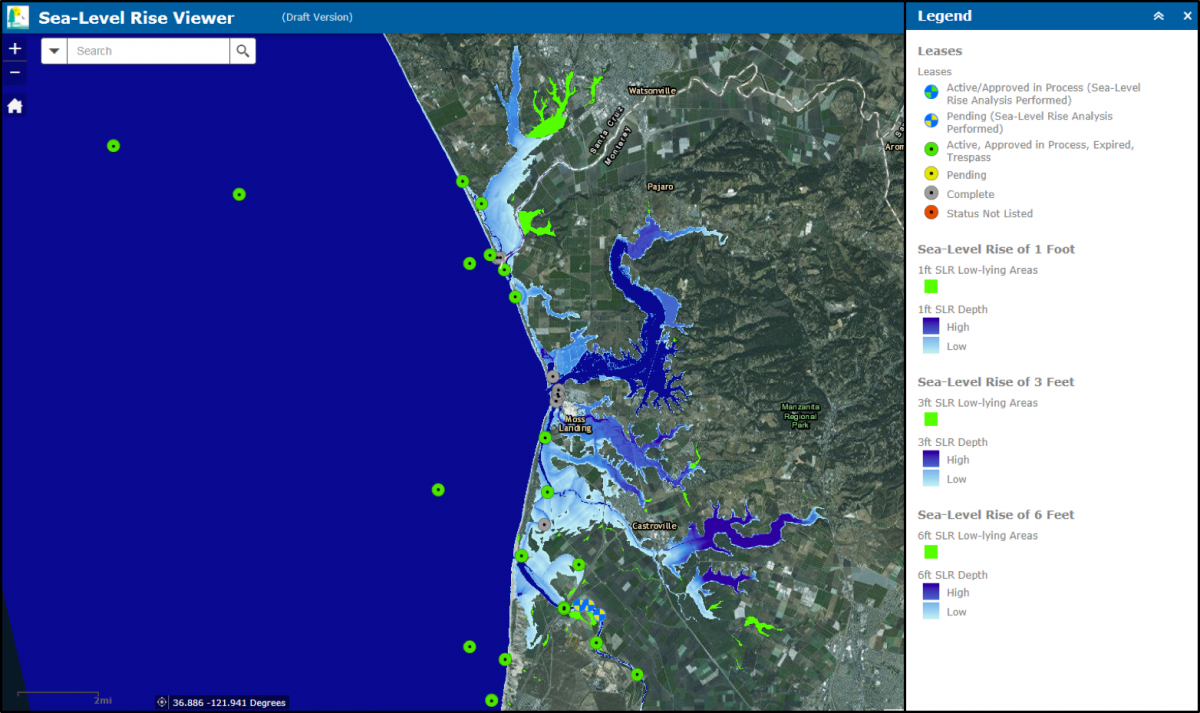
Various Inundation Scenarios
Moss Landing, CA
- Overlay sensitive habitats, critical infrastructure, and social economic data onto potential sea-level rise data
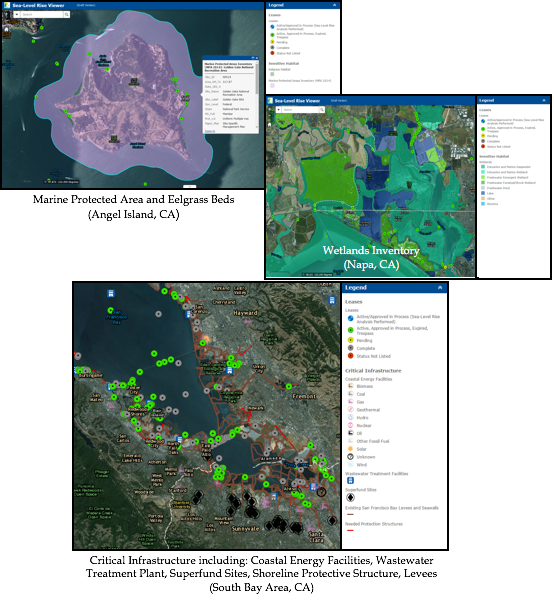
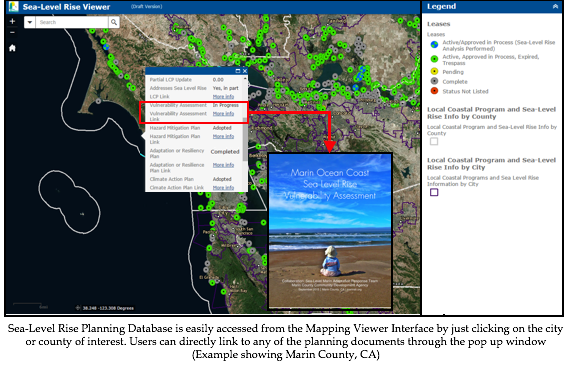
- Provides a database of sea-level rise planning documents, such as Local Coastal Programs, Sea-Level Rise Vulnerability Assessments, Adaptation Plans, and Local Hazard Mitigation Plans, across all coastal counties and communities
- Provides an up to date inventory of commission leases, and identifies leases already analyzed for sea-level rise
The real value of this tool is in the customized datasets integrated with the Commission’s original data (Commission Leases). This provides staff with a tool that allows them to see what’s going on the ground, and links them to data and resources in one centralized location which will increase efficiency.
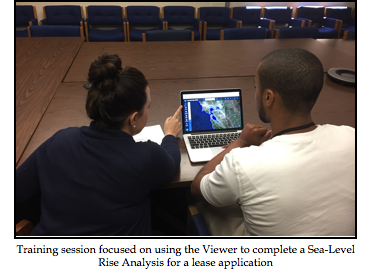
The last piece of the puzzle was to familiarize staff with the Viewer through training sessions focused on how to use the tool to complete a sea-level rise analysis and how to use the Viewer as a comminution and education tool when working with lessees in understanding the impacts of sea-level rise.
Written by Esther Essoudry