N/A


June 12, 2018
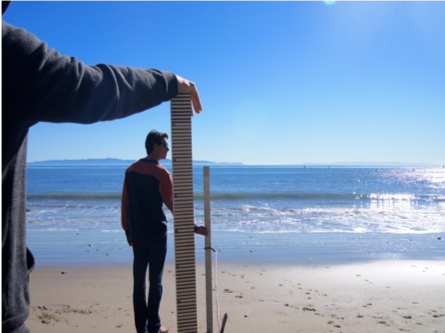
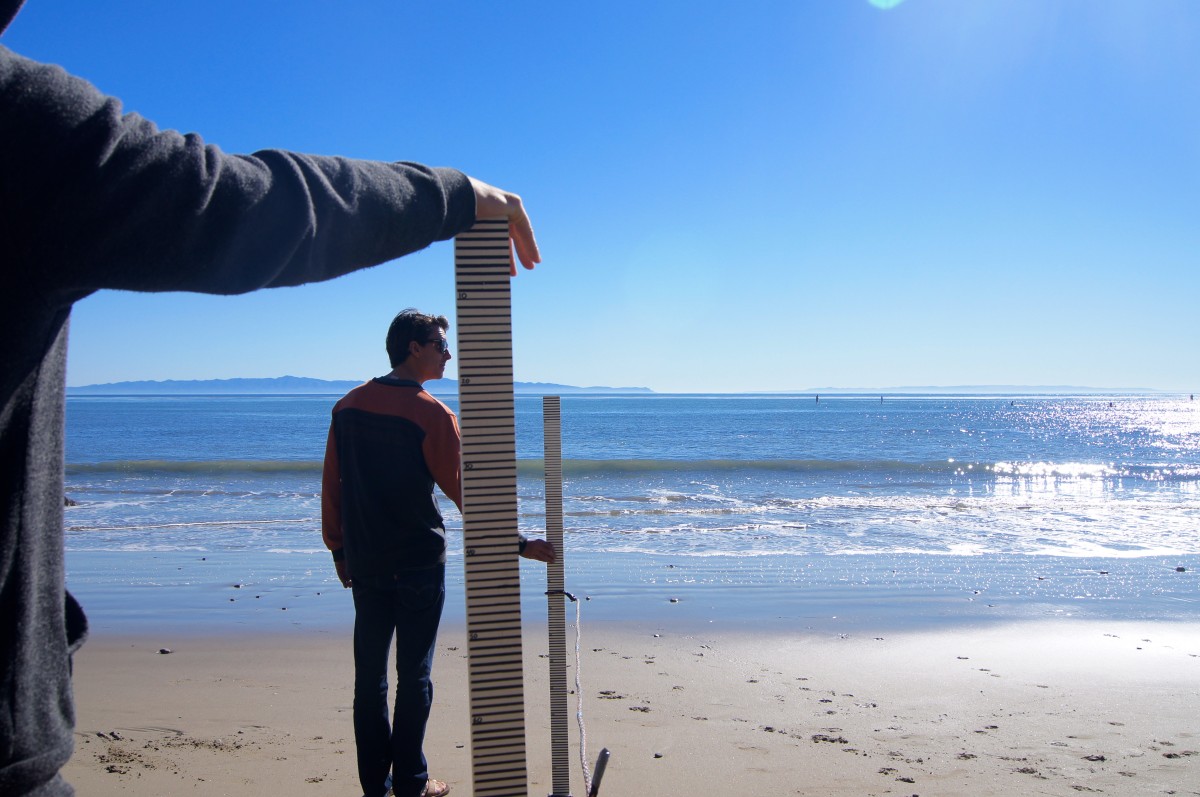
If you’ve been out at a beach in Santa Barbara or Ventura counties at low tide in the last year, you might have spotted a small group of people, armed with long rulers, twine, and clipboards.
These survey teams are volunteers working with the Community Alliance for Surveying the Topography of Sandy Beaches (CoAST SB) project. CoAST SB is an opportunity for community volunteers to collect scientific data on local beaches and how they change over time. For over a year, participants have conducted monthly surveys in Santa Barbara and Ventura counties to track physical changes on our dynamic coastline.
 The data help scientists monitor sandy beaches, a valuable resource that provides wildlife habitat, promotes tourism and recreation, and protects coastal development from wave damage. Scientists in the region monitor these beaches with more detailed surveys, but these only happen twice a year, which means they could miss a lot of seasonal variation.
Volunteers use a simple surveying technique known as beach profiling to measure the changes in slope across the width of the beach. The data help capture trends in beach sand erosion (removal) and accretion (accumulation). The graphed data reveal a cross-sectional view of the beach (imagine looking into the side of a layer cake) to offer a visualization of the contour of the beach.
Looking at our data from different surveys shows changes in the beach profile over time. This allows us to see both seasonal changes as well as the impacts of events such as the Montecito mudslide. Below is an example of Summerland Beach, south of Santa Barbara from Fall 2017 to Spring 2018.
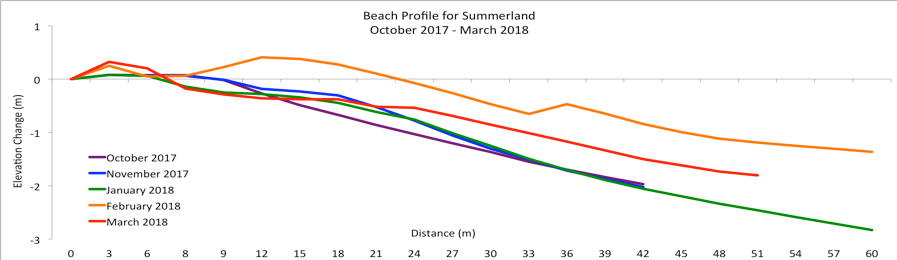
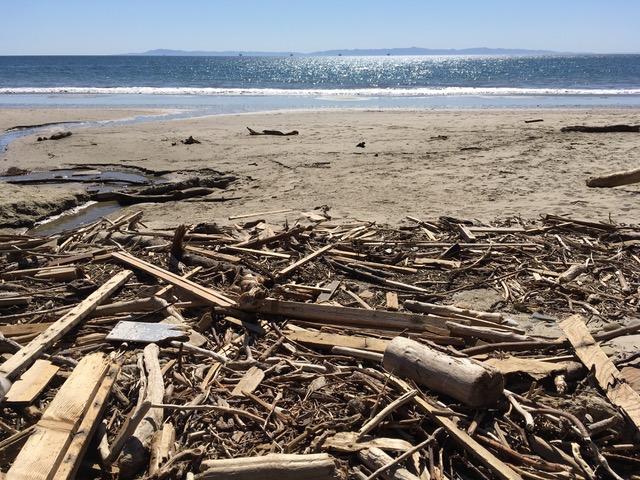
The left side of the graph is the landward edge of the beach and the right side is the seaward edge. Perhaps the most exciting feature of the graph is the difference between January and February’s profile. The height of the beach notably increased from January to February, associated with the Montecito mudslide. We speculate that sediment from the mudslide travelled to and deposited at Summerland beach, the first survey site down-current from the mudslide.
The monthly surveys help identify impacts from distinct events like the Montecito mudslide, as well as seasonal trends throughout the year. They also provide professional researchers with valuable data to supplement their biannual surveys.
If you are interested in volunteering or learning more about CoAST SB, please check out our website, or send an email to aaronhoward@umail.ucsb.edu.