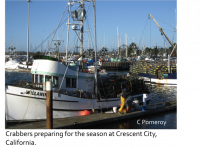
Commercial fisheries are an important part of California's economy. In 2011, approximately $201 million dollars in ex-vessel revenue (the amount paid directly to fishermen) came from commercial fishery landings, and more than 120,000 jobs on and off the water were supported by the state's seafood industry (NOAA 2011). Fishing communities from Crescent City in the north to San Diego in the south are centers of this activity, providing a diverse supply of seafood and a visible reminder of California's maritime heritage.
Fisheries are complex and dynamic systems, where people and nature are inextricably linked. While we cannot address all aspects of California fisheries here, this website provides information and insight to enhance understanding of how they work. We encourage you to visit other sources, including those listed throughout the website, as they provide information that complements the material presented here. Note that we use the term fish to refer to all types of finfish (e.g., salmon), shellfish (e.g., crab) and other invertebrate species (e.g., squid) that are caught in California.
This website provides information about key features of California's commercial fisheries statewide and by region including:
- Fishing communities
- Fisheries seasonality
- Regional seafood posters
- Statewide commercial fishery activity
- Measuring commercial fishery activity
- The ocean environment
- Management context
- Regions
Visit the Discover California Commercial Fisheries website
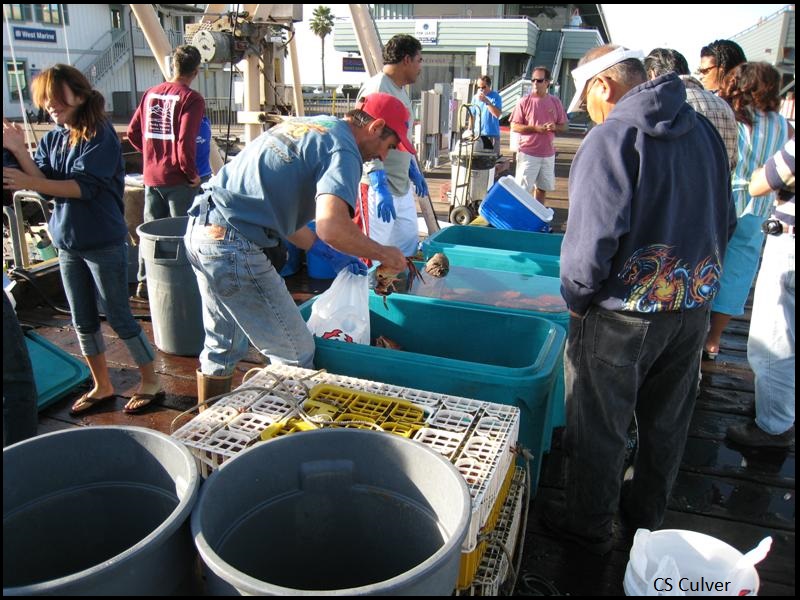
Commercial fishing communities
Fishing communities are an integral part of the ocean ecosystem. After all, boats don’t fish, people do! And it’s not just about the fishermen.
Types of commercial fisheries
What are the major commercial fisheries in California? What types of fishing gear and methods do fishermen use to catch these species? Get a sense of the great diversity.
Fisheries seasonality
When are certain types of seafood in season? It depends on where the fish are and what the regulations allow. Check out this section and the regional posters for examples of the variety of seafood caught in California.
Statewide commercial fishery activity
What are California’s top fisheries? Does fishery activity vary over time or across locations? Get a sense of patterns and trends.
Measuring fishery activity
How is fishery activity measured? How and why does that activity vary and change? Many factors are at play.
The ocean environment
What makes the ocean waters off California so productive for fisheries? Learn about the key physical features, currents and oceanographic conditions.

The management context
How are fisheries managed? Fisheries are managed through state and federal processes using a mix of regulations and other measures.
Fisheries by region
Are fisheries the same throughout California? Take a closer look at each of the state's five coastal regions.

Discover California Commercial Fisheries is a project led by California Sea Grant Extension Program (SGEP) Specialists Carolynn Culver and Carrie Pomeroy, with web pages designed and edited by Melissa Stevens, CASG Project Specialist, UC Santa Cruz, and Gillian Clague, SGEP Research Assistant, UC Santa Barbara. Many thanks to Debbie Marshall, former Research Associate at the CASG Extension Program office in Eureka, for graphics and other technical support, and to several fishing community members, resource managers and scientists who reviewed this website. The information presented here is the responsibility of the authors and does not necessarily represent the views of those who have contributed materials and information.
Fishing communities
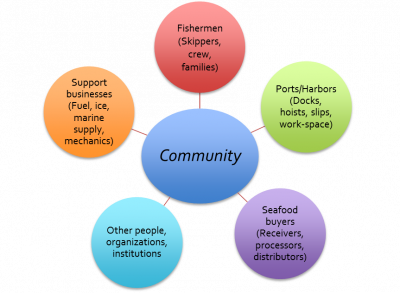
Fishing communities are an important part of California’s maritime heritage and economy and its coastal and ocean ecosystems. Viable commercial fisheries require not only healthy marine resources and habitat, but also people and businesses to support fishing activities. Those activities, in turn, support local economies and provide seafood to consumers.
According to the Federal Magnuson-Stevens Fishery Conservation and Management Act, a fishing community is defined as
… substantially dependent on or substantially engaged in the harvest or processing of fishery resources to meet social and economic needs, and includes fishing vessel owners, operators, and crew and United States fish processors that are based in such community.
However, a fishing community depends on these players and more to thrive and to get the catch to consumers. For example, harbors provide hoists, docks, boat slips and other amenities that are critical for offloading the catch, and provide “safe harbor,” protecting boats and people from potentially severe weather and ocean conditions. Likewise, marine supply, electronics, boat maintenance, and other businesses are essential for keeping fishing boats operating safely and effectively. Together, fishing operations, these support businesses, and the people who run them, are dependent on one another for their livelihood and well-being. As communities, they are connected to each other socially and economically, both locally and across regions.
And although the definition above focuses on communities as geographic places, fishing communities also may be defined by shared occupation or interest. Examples include the West Coast groundfish trawl fishing community and the southern California sea urchin and sea cucumber dive community.
Information sources
- Clay P.M., and J. Olson. 2008. Defining 'fishing communities': Vulnerability and the Magnuson-Stevens Fishery Conservation Act. Human Ecology Review 15:143-60.
- Norman, K., J. Sepez, H. Lazrus, N. Milne, C. Package, S. Russell, K. Grant, R.P. Lewis, J. Primo, E. Springer, M. Styles, B. Tilt, and I. Vaccaro. 2007. Community Profiles for West Coast and North Pacific Fisheries: Washington, Oregon, California, and Other U.S. States. Seattle, WA: NMFS Northwest Fisheries Science Center, 602 pp.
- Pomeroy, C., and M. Dalton. 2003. Socio-Economics of the Moss Landing Commercial Fishing Industry. Report to the Monterey County Office of Economic Development and the Moss Landing Study Steering Committee. Salinas, CA: Monterey County Office of Economic Development, 134 pp.
- Pomeroy, C., C. Thomson and M. Stevens. 2010. California's North Coast Fishing Communities: Historical Perspective and Recent Trends. California Sea Grant Technical Report T-072, La Jolla: California Sea Grant, August, 340 pp. Pacific Fishery Management Council (PFMC): Habitat and Communities: Fishing Communities
- Pacific States Marine Fisheries Commission (PSMFC) Pacific Fisheries Information Network (PacFIN) and Fisheries Economics Data Program (EFIN)
Fisheries seasonality
The timing of individual fisheries varies from region to region and year to year due to:
- Regulations
- Market demand
- Resource availability
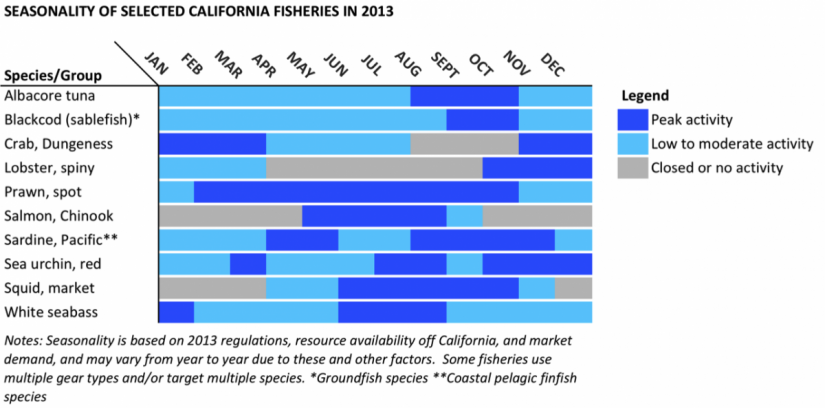
Fisheries also may be concentrated in certain areas at certain times during the season. For example, the Chinook (king) salmon troll fishery is generally open from May through September in the Central Coast region, and for a shorter time within that window along the North Coast. The squid fishery is open year-round (subject to early closure if the 118,000 metric ton quota is reached in less than 12 months), but is most active in the Central Coast region from April through September, and south of Point Conception from October through February.
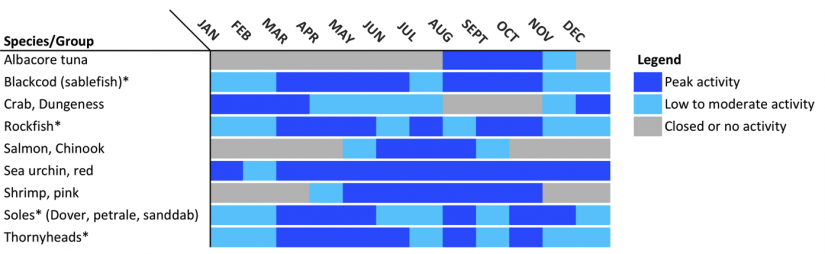
Below we provide a seasonality chart for several of California’s major commercial fisheries based on 2013 regulations, general resource availability, and market demand. Note that seasons do not necessarily start on the first day of the month or end on the last day of the month, as could be interpreted from the chart. Fisheries may have seasonal or year-round closures for particular areas, species, and/or gear types that may not be evident here. They also may have quotas which, if reached before then end of the season, will result in early closure of the fishery as occurred in the market squid fishery in 2013. See this website's management context page for further information. For information on fisheries seasonality for specific areas, visit the regional pages and downloadable regional posters.
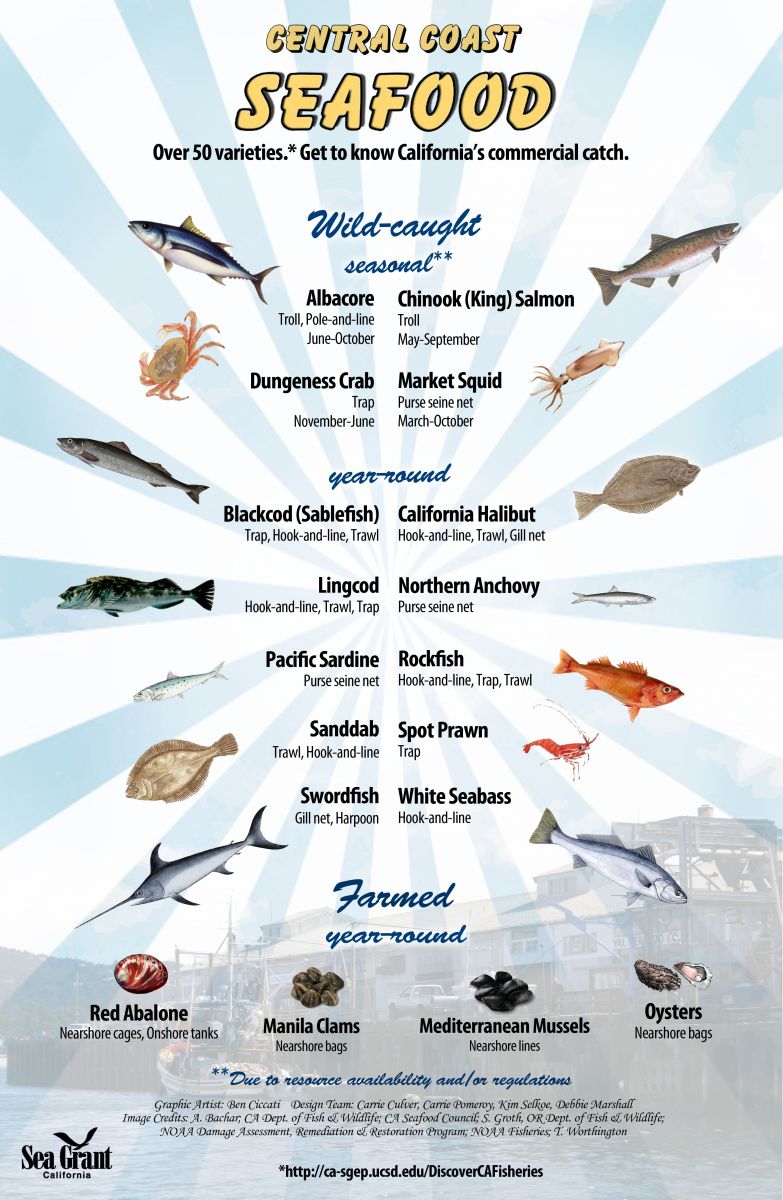
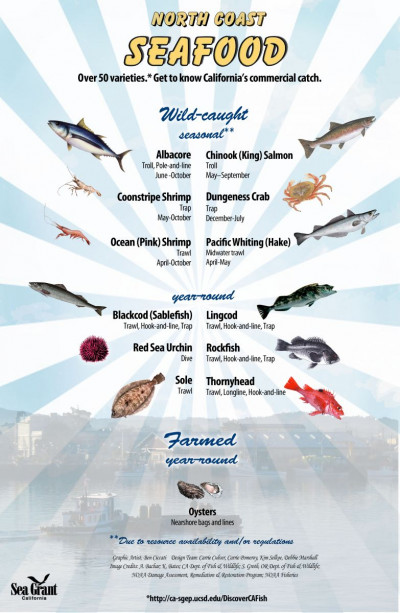
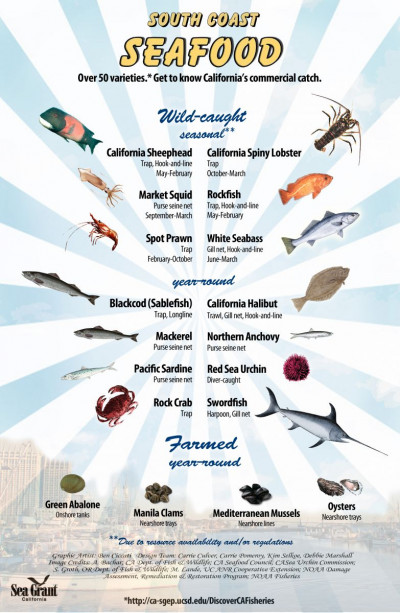
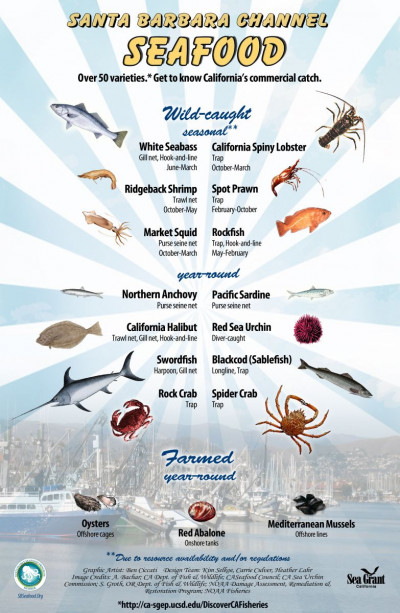
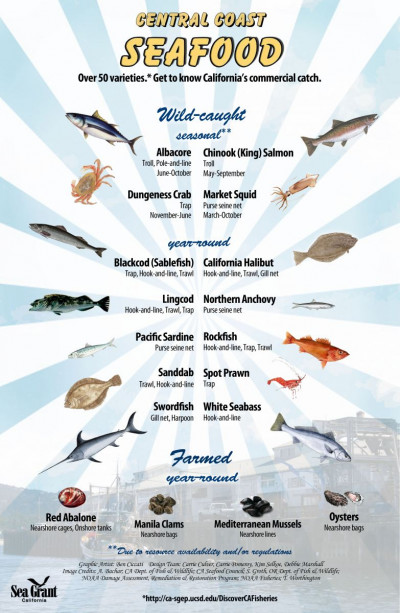
Regional seafood posters
These posters provide examples of some of the most commonly caught and farmed marine species in each region of the state, along with seasonality and gear or methods used.
Statewide commercial fishery activity
Commercial fishery activity – how much fish and shellfish is caught and brought to port (landed), what it’s worth, and how many people and businesses are involved – varies throughout the state, during the year, and from year to year. Exploring fishery landings data – information on landings and the amount paid to fishermen at the docks (‘ex-vessel value’) – can provide a general sense of fishery activity in California (see Measuring commercial fishing activity). Here we provide some general information on those measures over time, the state’s top fisheries, and a snapshot of how landings are distributed among the state’s coastal regions. Visit the region pages of this website to learn more about the fishery activity in each of the state’s five coastal regions.
California commercial fishing activity since 2000
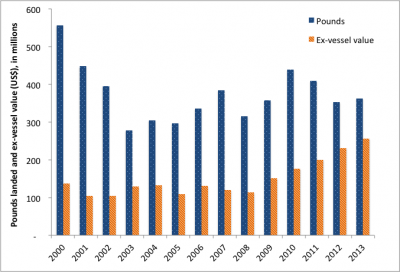
Fishing activity in California has changed over time largely due to increased regulation (to conserve resources) and environmental, social and economic factors, with a general downsizing of fisheries occurring over the past few decades. Focusing on the period since 2000, fishing activity has varied, with the following averages and extremes for the years 2000-2013. (Ex-vessel values are not adjusted for inflation.)
- Average (2000-2013): 374 million pounds, worth $150 million per year
- Highest poundage (2000): 557 million pounds worth $138 million
- Highest value (2013): $256 million, with 363million pounds landed
- Lowest poundage (2003): 278 million pounds, worth $129 million
- Lowest value (2001): $104 million, with 448 million pounds landed
For any given year, landings and value reflect the particular mix of species landed and the price per pound, both of which vary for many reasons. Fisheries are sometimes described by these two measures, being referred to as high-volume/low price-per-pound (e.g., squid, sardine) or low-volume/high price-per-pound (e.g., lobster, spot prawn).
Top fisheries statewide (2013)
Historically, the waters off California have supported a great variety of fisheries, for both finfish and shellfish. In 2013, commercial fishermen landed more than 363 million pounds (165,000 metric tons) of seafood at California’s coastal ports with an ex-vessel value of nearly $256 million. The top fisheries (species-gear combinations; in alphabetical order) with the most pounds landed and highest ex-vessel value (with some fisheries occurring in both categories) included:
| Ex-vessel value (≥ $10 million each) | Pounds Landed (≥ 13 million pounds each) |
|---|---|
| California spiny lobster | Coastal pelagic finfish (sardine, anchovy, mackerel) |
| Chinook salmon | Dungeness crab |
| Dungeness crab | Groundfish |
| Market squid | Market squid |
| Red sea urchin | Red sea urchin |
Regional contributions to state landings
Fishing activity varies within and among the state’s five coastal regions, and is a function of the:
- Distribution of the species
- Ocean environment
- Management context
- Port infrastructure and amenities
- Market demand and availability of buyers
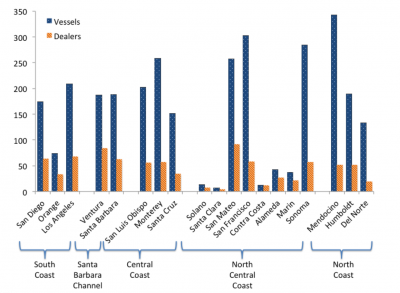
In 2012 (2013 data were not yet publicly available), about 1,900 commercial fishing vessels landed catch at California ports, with some 480 dealers buying and distributing the catch. Dealers include fishermen selling their own catch directly to the public, restaurants and grocers, as well as dedicated fish buyers (some of which also process the catch). As shown in the figure below, Mendocino, Monterey and Los Angeles counties had the greatest numbers of vessels with landings at their ports, whereas San Mateo, Ventura and Los Angeles counties had the greatest numbers of dealers.
California commercial fishery landings
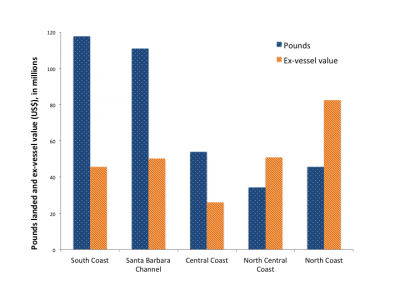
In 2013, landings (by weight) were concentrated in the more southerly regions of the state, while ex-vessel value was highest for the North Coast region (see chart below). These patterns were largely due to high landings of squid in the south (Los Angeles and Ventura counties), and the high ex-vessel value of Dungeness crab landings in the north (Humboldt and Del Norte counties).
These landings data are influenced by the combination of fisheries and markets in those areas. For example, the high-volume/low price-per-pound coastal pelagic species fisheries (for squid, sardine, mackerel and anchovy) are particularly active in the South Coast and Santa Barbara Channel regions, and moderately active in the Central Coast region. And although considerably less seafood is landed in the North Central Coast region, its fisheries include higher price-per-pound species such as Dungeness crab and Chinook (king) salmon, among others. Visit the North Coast, North Central Coast, Central Coast, Santa Barbara Channel, and South Coast.pages for more details about fishing activity there.
Information sources
Leet, W.S., Dewees, C.M., Klingbeil, R. and E.J. Larson. (2001). California's Living Marine Resources: A Status Report. 4th ed. Sacramento, CA: CDFG, 562 pp.
- CDFW Commercial Landings Information
- NMFS Commercial Fisheries Statistics
- Pacific States Marine Fisheries Commission (PSMFC) Pacific Fisheries Information Network (PacFIN)
Measuring commercial fishery activity
How is commercial fishery activity measured?
Commercial fishery activity happens both on the water, as fishermen target and catch marine species, and onshore, through the offloading, processing and distribution of seafood. The California Department of Fish and Wildlife (CDFW), together with the Pacific States Marine Fisheries Commission (PSMFC) and the National Marine Fisheries Service (NMFS), track this activity in several ways:
- Fish tickets/landings receipts – for each fishing trips, fishermen are required to report several types of information including the species and amounts (in pounds) landed, the amount paid to the fisherman for the catch, the gear used, area fished, place and date of landing, and the name of the vessel, skipper, and receiver (i.e., the shoreside fish-buying business or, if selling directly to the consumer, the fisherman).
- Vessel logbooks – for several fisheries (e.g., sea urchin, lobster, swordfish), fishermen record additional catch information such as the number of legal-sized individuals retained and the number of ‘shorts’ (under the size limit) returned to sea, the areas fished, and amount of gear used (e.g., number of traps pulled).
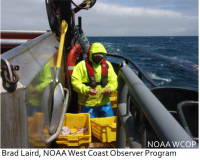
- Onboard observers – for certain fisheries (e.g., groundfish trawl, swordfish drift gillnet), onboard federal observers are required for some or all commercial fishing trips. They collect data on samples of the catch, effort (e.g., number and length of trawl tows), animals discarded (for economic or regulatory reasons), and encounters with marine mammals, seabirds and sea turtles.
- Port sampling – through a partnership between CDFW and PSMFC, agency personnel regularly collect data (e.g., species, sex, length, weight) on samples of the catch for several fisheries (e.g., groundfish, California halibut). These additional ‘fishery-dependent’ data support the estimation of population characteristics (e.g., age distribution, sex ratios), which in turn are used by fishery managers.
A fish ticket (or landings receipt) is completed each time a fisherman sells his catch – to a dockside buyer, a restaurant, or directly to a consumer. This information is entered into a database maintained by CDFW that allows both state and federal agency staff to analyze trends in a fishery to inform and evaluate fishery management. For some fisheries, the landings data are supplemented with logbook, observer and/or port sampling data, which are incorporated into fishery analyses and management. (As described in the next section, some landings data are available to the public.)
How are fisheries data used?
Fisheries data are analyzed to determine whether a fishery is stable, recovering, or requiring rebuilding, and appropriate management actions are developed and implemented. In some cases, data are reviewed periodically (usually annually or bi-annually) and regulations are updated as needed. In other cases, such as quota-managed fisheries (e.g., sardines, squid, groundfish) or where stocks are rebuilding (as for a small number of West Coast groundfish species), in-season management may be used. This means that landings are monitored in ‘real time’ during the season, and when the quota is reached, the fishery is closed.
Interpreting fishery landings data
Fishery landings data are not a direct measure of species abundance, as they are influenced by several factors:
- Species abundance
- Environmental conditions
- Regulations
- Economic conditions
Fishing activity can increase or decrease as the abundance or quality of product changes in association with weather events and other environmental conditions (e.g., the availability of prey species or increase of predators); as the economy and demand fluctuate with strengthening and weakening prices and the amount spent by consumers; and with changes in regulations such as limits on the number of permits, fishing days or the amount of fish that can be caught.
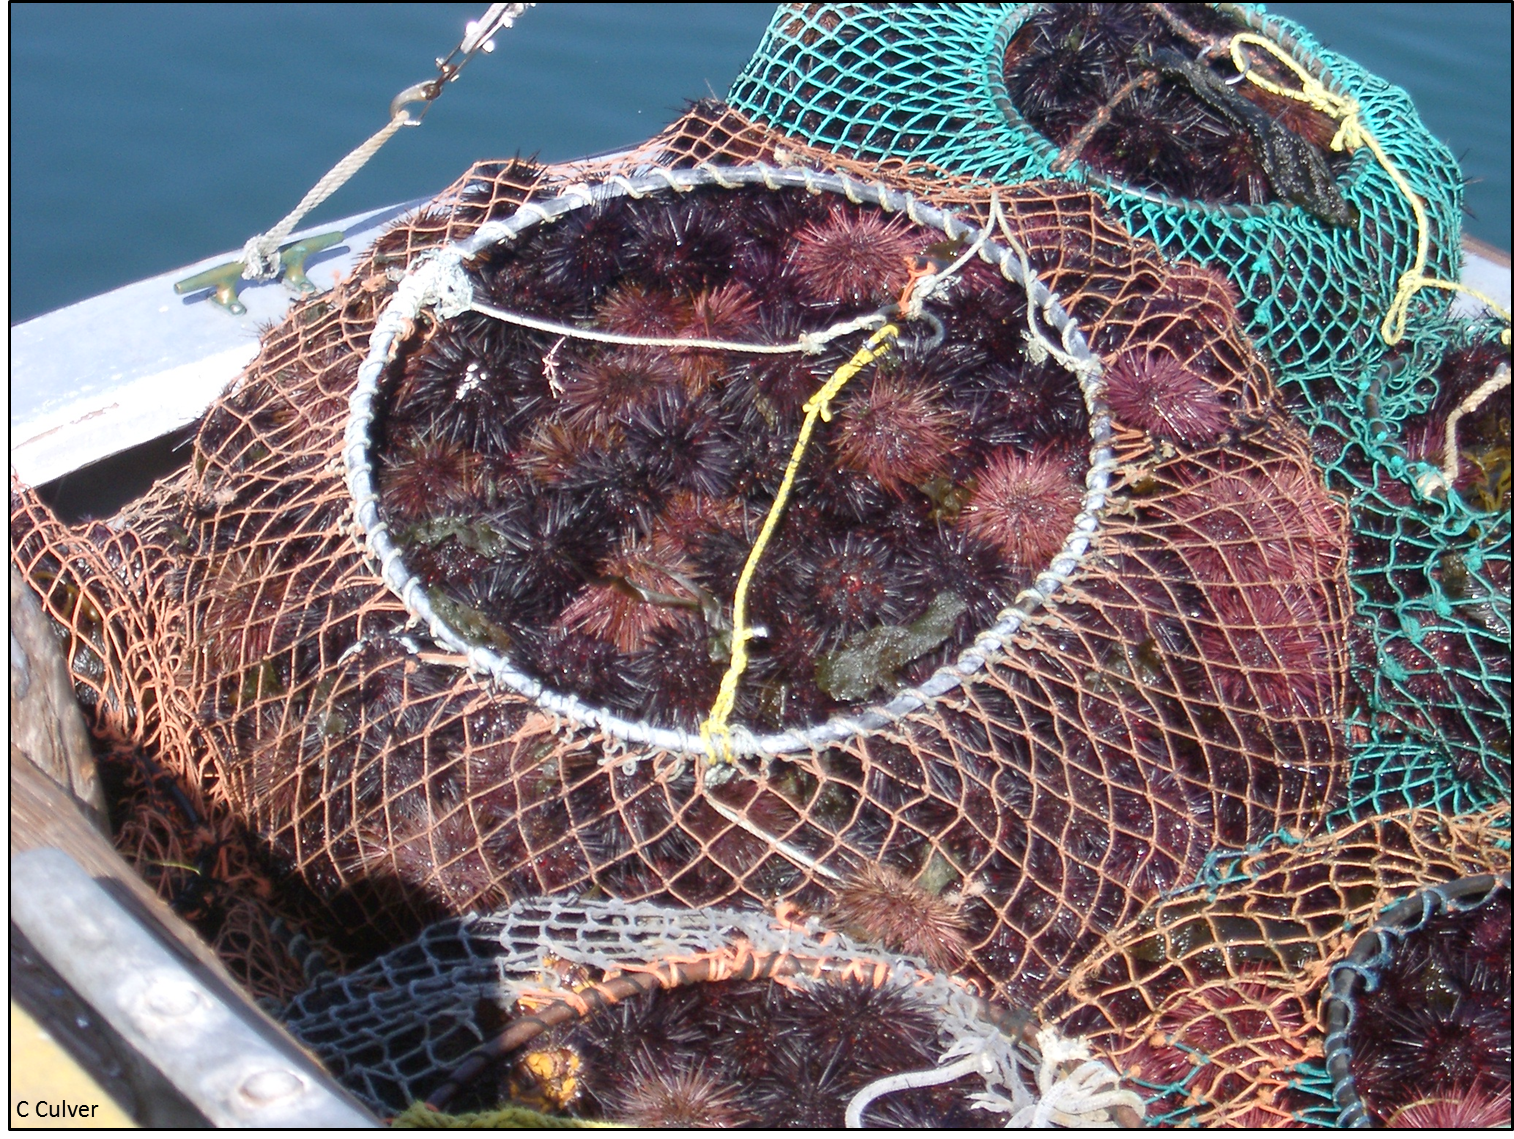
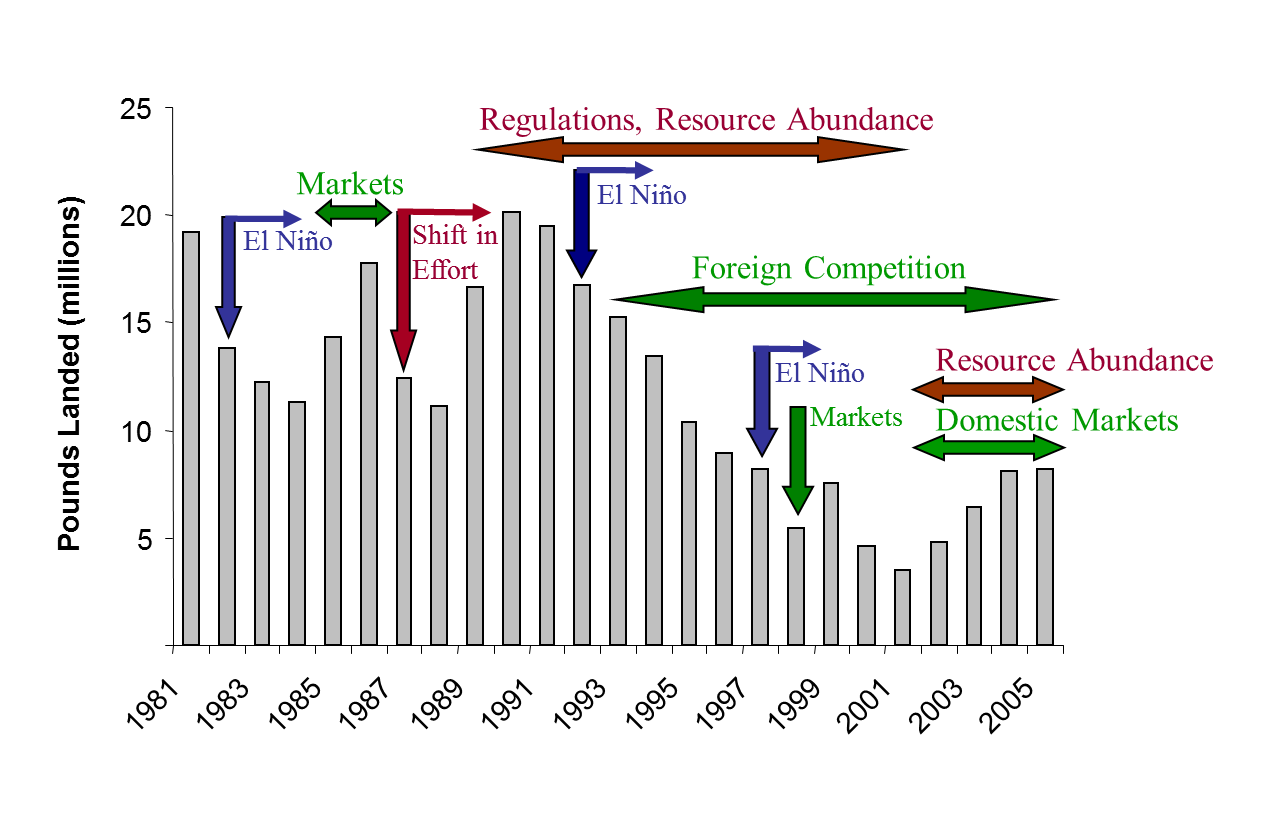
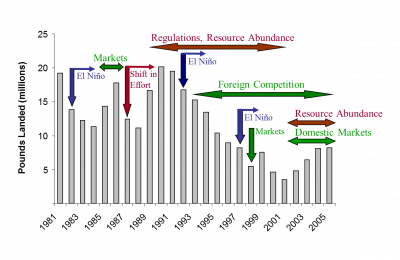
The annotated chart of the Santa Barbara Channel sea urchin fishery below shows how several different factors have influenced landings in the fishery over time. The arrows pointing down indicate years when identifiable events occurred, and the arrows pointing left and right indicate a multi-year period when the fishery was influenced by a specific event or circumstance. (Long-term effects are not included.) In the 1980s and 1990s, this was the most valuable fishery in California. Since then, however, activity in the fishery has declined due to several factors including: 1) environmental conditions (e.g., El Niño events, which reduce the abundance and quality of kelp, their food source), 2) lower abundance of animals, 3) newly implemented regulatory restrictions (e.g., reducing the number of permitted divers from 900 to 300), 4) a weakened Japanese economy (i.e., leading to decreased demand), and 5) increased competition from sea urchin producers in other countries (e.g., Russia).
Publicly available data
You, too, can explore fisheries landings data through certain websites. Just keep in mind what we have described here: while decreases in fishery activity may reflect decreases in species abundance, it is critical to consider other factors as well when interpreting landings data as they often are major factors influencing fishing activity (with resource abundance playing little or no role in those trends). This is particularly true in California as many new regulations, including restricted access (limited entry), quotas, and time and area closures have been implemented, especially since the mid 1990s, resulting in the downsizing of many California fisheries.
Also, while the above chart examines trends in the volume (pounds) landed, one can explore changes in the value of the fishery over time using landings data. However, similar factors influence the value and volume of a fishery and should be considered when interpreting these data.
With all of this in mind, we encourage you to explore the publically available California landings data – both the amount and value landed for each fishery – through the CDFW website. Landings from 2000 through the most recent calendar year (by June the following year) are reported annually by port, region and statewide. (The PSMFC’s Pacific Fisheries Information Network (PacFIN) database also archives these data and a variety of data summaries for Washington and Oregon as well as California, and the NMFS maintains a searchable commercial fisheries statistics website.)
Information sources
CDFW Commercial Landings Information
NMFS Commercial Fisheries Statistics
Pacific States Marine Fisheries Commission (PSMFC) Pacific Fisheries Information Network (PacFIN)
The ocean environment
The dynamic and diverse oceanographic conditions and physical environment off the California coast support a vast array of marine plants and animals. Together, these elements provide the foundation of California’s commercial fisheries. The abundance and availability of fisheries species is influenced by:
- Ocean currents
- Upwelling
- Climate patterns
- Habitat
To be successful, fishermen must understand how these features interact and affect the species they target and their fishing operations, and adapt their fishing plans and practices accordingly.
Ocean currents
The California Current System is a complex set of warm and cold water masses that create one of the most productive marine environments in the world. Its dynamic currents – including the California Current, the Davidson Current and the Southern California Countercurrent – influence the species available and their movements, both of which vary considerably along California’s 1,100-mile coastline (mainland plus offshore islands).
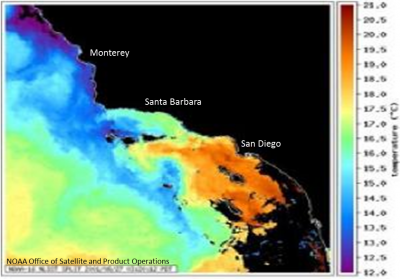
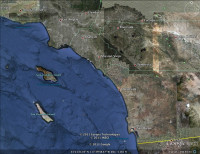
Generally, the currents flow north or south parallel to the coast, at various depths, and sometimes in opposite directions from each other. These currents, along with other climatic conditions, influence water temperatures along the coast, with Northern and Central California generally having cooler water than Southern California. The Santa Barbara Channel area is a "transition zone" where these waters and associated species mix. The satellite image to the left shows sea surface water temperatures for the California coastline from Monterey County to San Diego. Purple and blue colors denote the coldest water. Orange and red colors denote the warmest water.
Upwelling
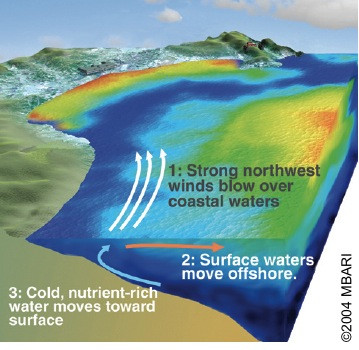
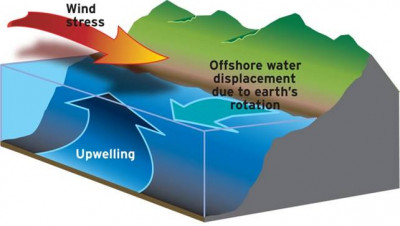
Coastal upwelling is a wind-driven phenomenon that brings cold, nutrient-rich waters to the surface along the coast, enhancing productivity in the ocean. Upwelling events, or the lack thereof, also influence transport of larvae to and from the shore, thereby impacting fish stocks. The intensity of upwelling is a result of:
- wind strength, direction and duration
- seasonal variability in climate patterns
- bathymetry (water depth and marine terrain)
Several marine regions in California experience strong upwelling events. (See regional pages for more information).
Climate patterns
Oceanographers have detected two primary sets of oceanic climate patterns that affect the waters off the California coast: the El Niño-Southern Oscillation (ENSO) and the Pacific Decadal Oscillation (PDO).
The ENSO cycle has two phases – a warm phase (El Niño) and a cold phase (La Niña) – where sea surface temperatures deviate from normal, particularly in the tropics and often extending northward in the Pacific Ocean. While ENSO conditions may cause extreme weather (such as floods or droughts), they also affect upwelling and other ocean processes along the California coast.
For example, the reduced upwelling associated with El Niño events can sharply reduce ocean productivity, impacting fisheries. The quality of sea urchin roe (the part of the animal that is consumed) dramatically decreases, as kelp beds (their primary food source) dwindle with warm water conditions. The opposite occurs during the cold-water phase – the quality of sea urchins improves as kelp beds flourish. El Niño and La Niña events also can affect where marine organisms occur (e.g., water depth, distance from and location relative to the coast). For example, a scarcity of California market squid on their usual fishing grounds is strongly associated with El Niño events, while such oceanic warming tends to bring albacore tuna closer to shore.
As its name suggests, the Pacific Decadal Oscillation (PDO) is a long-term (20- to 30-year) pattern of climate variability in the North Pacific that extends down into the tropics. Like ENSO events, the PDO has been characterized by cold eras (e.g., 1947-1976) that enhance ocean productivity and by warm eras (e.g., 1977-1998 and beyond) that limit it. In recent years, the long-term pattern observed in previous years has shifted to a much shorter-term pattern, including a shift occurring after as little as 10 months in 2010, with implications for the marine ecosystem and fisheries resources.
Other, larger forces including global warming and ocean acidification also affect climate patterns and related conditions. Visit these sources to learn more:
Climate change
Global warming
Ocean acidification
- NOAA Pacific Marine Environmental Laboratory: Ocean acidification: The other carbon problem
- Southern California Coastal Water Research Project: Ocean Acidification Workshop
Habitat
The California coast provides a broad array of marine habitats:
- sand bottom
- mudflats and protected bays
- shallow intertidal rocky reefs and kelp beds
- open waters of the continental shelf
This variety of habitats adds to the productivity and diversity of California fisheries. Compared to other coastal states, California’s continental shelf (the submerged extension of the coast before it drops off to the ocean bottom) is relatively narrow and deep. In addition, offshore islands add to the amount and diversity of available habitat for marine organisms, further enhancing the productivity and resulting fisheries of California waters. These islands include the:
- Farallon Islands off the North Central Coast
- Northern Channel Islands of the Santa Barbara Channel
- Southern Channel Islands off Southern California
Management Context
California fisheries – and fishery participants – are managed by diverse state and federal regulations designed and implemented by several agencies. All commercial fishermen (captains and crew) are required to have a license from the state (renewed annually). In addition, nearly all fisheries require a fishery-specific permit. Similarly, businesses that purchase seafood from fishermen are required to have appropriate licenses and permits and to meet health and safety standards designed to ensure that seafood provided to the public has been handled properly.
Here we describe:
- Common management tools
- Management authorities and frameworks
- Fishery management plans for California fisheries
For information on how fisheries data are collected and analyzed, see the “Measuring Fishery Activity” page.
Common management tools
Fisheries are managed using a combination of regulations aimed at allowing appropriate catch levels to sustain healthy marine ecosystems and associated coastal communities. Regulations can differ across regions, especially with variations in fishery resources, marine environmental conditions and fishing practices. The most common management measures are:
- Closed seasons and/or areas - prohibit fishing for one or more species at particular times (e.g., spawning seasons) and/or places (e.g. rockfish conservation areas (RCAs), marine protected areas (MPAs))
- Gear restrictions - set standards such as minimum mesh sizes for nets, specific types of hooks, or minimum size of escape ports for traps
- Size limits - control what size animals can be retained and sold
- Restricted access (including limited entry) - limits the number of participants in a fishery
- Quotas - limit the amount of fish that can be taken over a specified period of time by the entire fleet and/or individuals (e.g., catch shares)
- Landing or trip limits - similar to quotas, these limit the amount of fish landed per trip and/or the number of trips per season
Management authority
Fisheries are managed through state, federal and international processes. Who manages a fishery depends largely on where it occurs:
- State waters: 0-3 nautical miles from shore
- Federal waters: 3-200 nautical miles from shore
- International waters: outside the 200- nautical mile US Fisheries Conservation Zone
Some species that move along the entire West Coast, such as sardines, are managed at the federal level even though they are caught primarily in state waters. In some cases (e.g., tunas, Pacific halibut, salmon), fisheries also may be subject to international management agreements, which in turn influence federal and state management. The following chart provides a few examples of California fisheries and associated management authority.
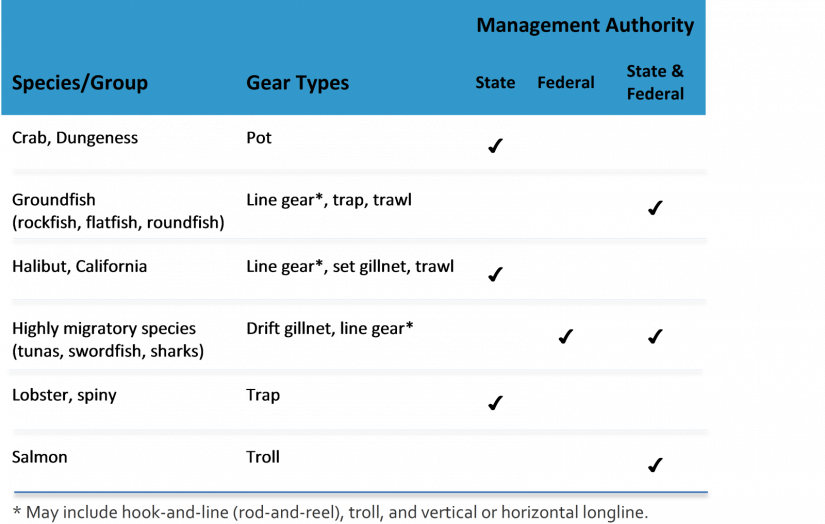
Multiple government agencies manage California fisheries, guided by overarching and fishery-specific policies, including:
- The California Legislature and the California Fish and Game Commission (CFGC) establish policy and provide guidance to the California Department of Fish and Wildlife (CDFW) for management of the state’s fisheries (consistent with any federal fishery management plans (FMPs)).
- The Marine Life Management Act (MLMA) of 1998 delegated state fishery management authority from the Legislature to the CFGC for commercial fisheries that had not been managed by legislative action prior to the Act's passage. (Some fisheries previously managed by the Legislature such as squid have been '"grandfathered" in so that they fall under provisions of the MLMA.)
- The Marine Life Protection Act (MLPA), passed by the California Legislature in 1999, provided for the establishment of a network of marine protected areas, including areas that prohibit some or all commercial fisheries.
- The Magnuson-Stevens Fishery Conservation and Management Act (MSA), passed by Congress in 1976, was the nation’s first comprehensive federal fisheries legislation. The MSA established eight regional fishery management councils, and required the development of FMPs for fisheries that occur in federal waters. The MSA was amended as the Sustainable Fisheries Act (SFA) of 1996, and identified 10 National Standards to guide FMP development and federal fishery management more generally. (The MSA is reauthorized every 10 years.)
- The Pacific Fishery Management Council (PFMC) designs management measures for fisheries that occur in federal waters along the coasts of California, Oregon and Washington. The Secretary of Commerce evaluates the measures which, if approved, are implemented by the National Marine Fisheries Service (NMFS).
California fishery management plans
As mandated by federal and state policy, CDFW, CFGC, PFMC, and NMFS staff create and update FMPs for species (e.g., white seabass) or species group (e.g., groundfish) with input from scientists, fishery managers and stakeholders. While the state and federal processes differ somewhat from one another, both involve the analysis of biological, environmental, economic and social factors affecting the fishery, with development and modification (as needed) of management alternatives and regulations. As such, these documents cover a range of information including the history of the fishery, the biology and status of the fishery population(s), the socioeconomics of the fishery, and management alternatives. Each FMP undergoes public and agency review before it is approved and implemented. In some cases, state- or federally-appointed advisory groups, which include fishery participants and representatives of environmental non-governmental organizations and the general public, play an ongoing role in the management process.
Information sources
California Code of Regulations, Title 14 - complete listing of state fishing regulations
CDFW. 2014. California Fishing Regulations Commercial Digest 2014-2015. Sacramento, CA: The Resources Agency, CDFW, 129 pp.
Leet, W.S., Dewees, C.M., Klingbeil, R. and E.J. Larson. 2001. California's Living Marine Resources: A Status Report. 4th ed. Sacramento, CA: CDFG, 562 pp.
Wallace, R., and K. Fletcher. 2001. Understanding Fisheries Management: A Manual for understanding the Federal Fisheries Management Process, Including Analysis of the 1996 Sustainable Fisheries Act. 2nd ed. University, MS: Mississippi-Alabama Sea Grant Consortium.
California legislative information
Regions
Located along the state's 1,100-mile coastline, California fisheries and fishing communities are many and diverse. We have divided the state into five regions, based on fishing activity, regional market patterns, and state and federal management. Follow the links below to explore the five regions.
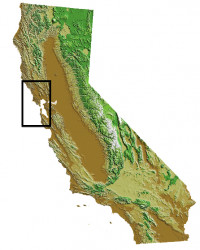
North Coast - Oregon Border to Point Arena
North Central Coast - South of Point Arena to Half Moon Bay
Central Coast - South of Half Moon Bay to Point Conception

Santa Barbara Channel - Point Conception to Point Dume
South Coast - Point Dume to Mexico border
North Coast
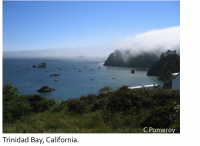
California's North Coast region extends from the Oregon border (Del Norte County) south to Point Arena in Mendocino County. People living in this isolated part of the state have long used fishery resources for livelihood, sport and subsistence. Since at least 2,000 years before European explorers arrived in North America, native peoples have inhabited the North Coast region. Their cultures, communities and livelihoods continue to depend on the region’s diverse native plants and animals, particularly Chinook salmon. Most of the region’s present-day coastal ports were established during the Gold Rush years of the 1850s. Over the years, amid significant changes locally and globally, the region’s fisheries continue to play an important role, economically, socially and culturally.
Fishing communities
This region encompasses three counties with eight primary port-based fishing communities (listed north to south):
| Del Norte County | Humboldt County | Mendocino County |
|---|---|---|
| Crescent City | Trinidad | Fort Bragg (Noyo Harbor) |
| Eureka | Albion | |
| Fields Landing | Point Area | |
| Shelter Cove |
Types of commercial fisheries
Historically, this region has supported a variety of fisheries, with groundfish, salmon and crab among the most active. However, the mix of fisheries and level of activity in each port and throughout the region varies as a function of changes in species distribution and availability, market demand, regulations, physical infrastructure, buyers and other factors. This region's fisheries and communities have been influenced strongly by stringent salmon regulations to protect stocks and provide for tribal harvests in the rivers, and by complex management of the multi-species, multi-gear groundfish fishery.
In 2013, commercial fishermen landed just under 46 million pounds (nearly 21,000 metric tons) of seafood in this region with an ex-vessel value (amount paid to fishermen) of $82.6 million. The top fisheries (species-gear combinations; in alphabetical order) in terms of pounds landed and/or ex-vessel value included:
See our regional seafood posters and the California commercial landings data (links below) to learn more about the fisheries of this region.
| Ex-vessel value (≥ $3.5 million each) | Pounds landed (≥ 1.2 milion pounds each) |
|---|---|
| Blackcod (sablefish) hook-and-line, trap, trawl | Blackcod hook-and-line, trap, trawl |
| Dungeness crab pot | Dungeness crab pot |
| Groundfish (rockfish, flatfish) hook-and-line, trap, trawl | Groundfish hook-and-line, trap, trawl |
| Pink shrimp trawl | Pink shrimp trawl |
| Red sea urchin dive | Red sea urchin dive |
| Salmon (Chinook or king) troll |
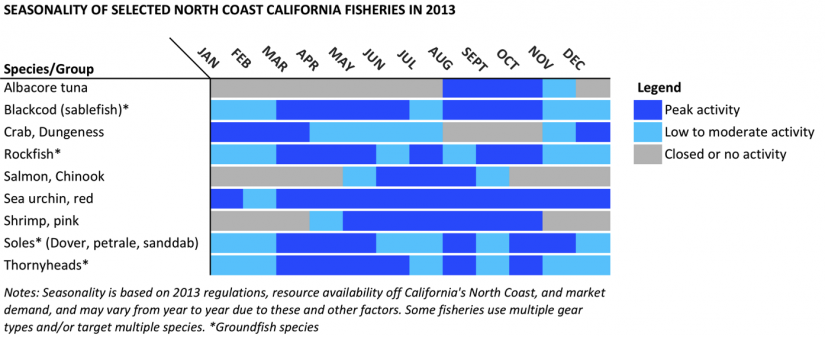
Fisheries seasonality
The chart below shows the times of year when the North Coast region's major commercial fisheries are most active. Other smaller fisheries, while also important, are not shown here. This chart combines all gear types that target the indicated species. Note that fishing activity does not necessarily start at the beginning or stop at the end of a month, and that the timing and types of fisheries may vary from year to year. (See state and federal commercial fishing regulations for current and specific dates.)
Seasonality of selected North Coast California fisheries in 2013
The local ocean environment
The North Coast's ocean environment hosts some of the state's most productive fishing grounds. Key features include:
- Bays and estuaries (e.g., Humboldt Bay, the Klamath and Mad River Estuaries)
- Rivers (e.g., the Klamath, Eel, Mad)
- Submarine canyons (e.g., Eel, Delgada, Mattole, Mendocino)
- Nearshore and two primary offshore reefs (Blunts and Saint George)
These features, along with strong coastal upwelling, add to the productivity of the region's marine ecosystem. The area north of Cape Mendocino also is subject to dangerous winter storms, high winds, and summer fog. While these conditions contribute to the region’s high productivity, they also are an important limiting factor for fishing.
The management context
The region's commercial fisheries are managed by the state through the California Legislature, the Fish and Game Commission and the Department of Fish and Wildlife (CDFW); by the federal government through the Pacific Fishery Management Council (PFMC) and National Marine Fisheries Service (NMFS); or by both (see Management Context for more information). The following table shows which government entity (or entities) has management authority and the management measures used for some of the region’s most active fisheries.
| Fishery | Management Authority | Management Measures | |||||
|---|---|---|---|---|---|---|---|
| State | Federal | Limited entry | Quotas | Time/area closures | Species size/sex rules | Gear restrictions | |
| Blackcod (sablefish) hook-and-line, trap, trawl | ✓ | ✓ | ✓ | ✓ | ✓ | ✓ | ✓ |
| Dungeness crab pot | ✓ | ✓ | ✓ | ✓ | ✓ | ||
| Groundfish hook-and-line, trap, trawl | ✓ | ✓ | ✓ | ✓ | ✓ | ✓ | ✓ |
| Pink shrimp trawl | ✓ | ✓ | ✓ | ||||
| Salmon troll | ✓ | ✓ | ✓ | ✓ | ✓ | ✓ | ✓ |
Note: Management authority and/or measures may vary for a given fishery depending on species and/or gear type.
Information Sources
California Marine Life Protection Act Initiative (CA MLPAI). 2010. MLPAI Regional Profile of the North Coast Study Region (California-Oregon Boarder to Alder Creek), April, 327 pp.
Impact Assessment, Inc. 2010. North Coast Pre-MLPA Community-Based Socioeconomic Characterization and Risk Assessment, Final Report to the Headwaters Fund, December, 204 pp.
Leet, W.S., Dewees, C.M., Klingbeil, R. and E.J. Larson. 2001. California's Living Marine Resources: A Status Report. 4th ed. Sacramento, CA: CDFG, 562 pp.
Pomeroy, C., C. Thomson and M. Stevens. 2010. California's North Coast Fishing Communities: Historical Perspective and Recent Trends. California Sea Grant Technical Report T-072, La Jolla: California Sea Grant, August, 340 pp.
- CDFW Commercial Landings Information
- NMFS Commercial Fisheries Statistics
- Pacific States Marine Fisheries Commission (PSMFC) Pacific Fisheries Information Network (PacFIN)
North Central Coast
The North Central Coast region extends from south of Point Arena in southern Mendocino County to Half Moon Bay in San Mateo County, and includes San Francisco Bay. The more isolated fishing communities of Bodega Bay (Sonoma County) and Half Moon Bay (San Mateo County) are juxtaposed by the heavily populated, urban port communities of San Francisco Bay. Historically, San Francisco was the center of the booming salmon industry that came on the heels of the Gold Rush in the 1850s. Many seafood companies expanded from there, connecting transport routes with the North and Central Coast, supplying customers as far away as New York City via rail. Today's fishing in this region and throughout California is quite diverse, supplying local, regional and international markets.
Fishing communities
This region encompasses five counties with eleven primary port-based fishing communities (listed north to south):
| Sonoma County | Marin County | San Francisco County | Alameda County | San Mateo County |
| Bodega Bay | Bolinas | San Francisco | Alameda | Half Moon Bay |
| Point Reyes | Berkeley | |||
| Tomales Bay | Oakland | |||
| Sausalito | Richmond |
Types of commercial fisheries
Historically, this region has supported a variety of fisheries, with Dungeness crab, herring and salmon among the most active. However, the mix of fisheries and level of activity in each port and regionally varies as a function of changes in species distribution and availability, market demand, regulations, physical infrastructure, buyers and other factors.
In 2013, commercial fishermen landed more than 34.2 million pounds (15,563 metric tons) of seafood in this region with an ex-vessel value (amount paid to fishermen) of more than $51.5 million. The top fisheries (species-gear combinations; in alphabetical order) in terms of pounds landed and/or ex-vessel value included:
See our regional seafood posters and the California commercial landings data (links below) to learn more about the fisheries of this region.
| Ex-vessel Value (≥ $1 million each) | Pounds Landed (≥ 1 million pounds each) |
|---|---|
| California halibut hook-and-line, trawl | Dungess crab pot |
| Dungeness crab pot | Groundfish (flatfish, rockfish, roundfish, hook-and-line, trap, trawl) |
| Herring roe gillnet, kelp raft | Herring roe gillnet, kelp raft |
| Market squid seine | Market squid seine |
| Salmon (Chinook or king) troll | Salmon troll |
| Swordfish gillnet, harpoon |
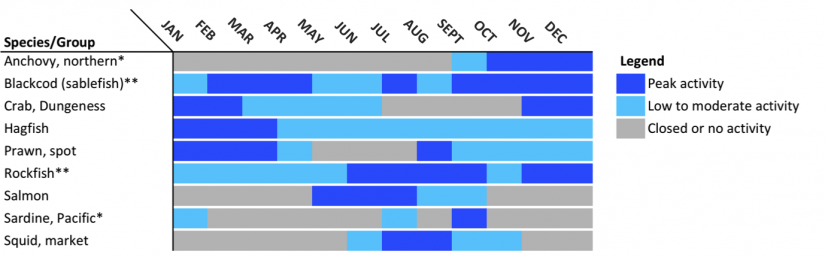
Fisheries seasonality
The chart below shows the times when the major commercial fisheries of the North Central Coast region are most active. Other, smaller fisheries, while also important, are not shown here. This chart combines all gear types that target the indicated species. Note that fishing activity does not necessarily start at the beginning or stop at the end of a month, and that the timing and types of fisheries may vary from year to year. (See state and federal commercial fishing regulations for current and specific dates.)
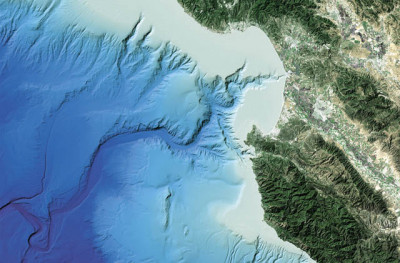
The local ocean environment
The North Central Coast region is characterized by several unique geographical features that affect ocean conditions and weather and include:
- Bodega Head
- Point Arena and Point Reyes
- Farallon Islands
- San Francisco Bay
Several of these features are part of the region’s upwelling system, in which cold, nutrient-rich waters stream from Point Arena south to Point Reyes, Cordell Bank and the Farallon Islands. While much of the region’s seafloor habitat is soft (sand or mud) bottom, there also are rocky reefs, pinnacles, and outcrops. All of these features contribute to prime habitat (including rich feeding grounds) that support the region’s many and diverse fisheries.
The management context
The region's commercial fisheries are managed by the state through the California Legislature, the Fish and Game Commission and the Department of Fish and Wildlife (CDFW); by the federal government through the Pacific Fishery Management Council (PFMC) and National Marine Fisheries Service (NMFS); or by both (see Management Context for more information). The following table shows which government entity (or entities) has management authority and the management measures used for some of the region’s most active fisheries.
| Fishery | Management Authority | Management Measures | |||||
|---|---|---|---|---|---|---|---|
| State | Federal | Limited Entry | Quotas | Time/area closures | Species size/sex rules | Gear restrictions | |
| Blackcod (sablefish) hook-and-line, trap, trawl | ✓ | ✓ | ✓ | ✓ | ✓ | ✓ | ✓ |
California halibut hook-and-line, set gillnet, trawl | ✓ | ✓ | ✓ | ✓ | ✓ | ||
| Dungeness crab pot | ✓ | ✓ | ✓ | ✓ | ✓ | ||
| Market squid seine | ✓ | ✓ | ✓ | ✓ | ✓ | ||
| Pacific herring gillnet | ✓ | ✓ | ✓ | ✓ | ✓ | ✓ | |
| Salmon troll | ✓ | ✓ | ✓ | ✓ | ✓ | ✓ | ✓ |
Note: Management authority and/or measures may vary for a given fishery depending on species and/or gear type.
Information sources
California Marine Life Protection Act Initiative (CA MLPAI). 2007. MLPAI Regional Profile of the North Central Coast Study Region (Alder Creek/Point Arena to Pigeon Point, California), October 8, 182 pp.
Largier, J. 2007. The Environment – Ocean Patterns: If We Knew the Hue of the Blue. Presentation to the California MLPA North Central Coast Regional Stakeholder Group. November 19, 2007.
Leet, W.S., Dewees, C.M., Klingbeil, R. and E.J. Larson. 2001. California's Living Marine Resources: A Status Report. 4th ed. Sacramento, CA: CDFG, 562 pp.
CDFW Commercial Landings Information
NMFS Commercial Fisheries Statistics
Pacific States Marine Fisheries Commission (PSMFC) Pacific Fisheries Information Network (PacFIN)
Central Coast
The Central Coast region extends from Santa Cruz County south along Monterey Bay and the isolated Big Sur coast in Monterey County, to Morro Bay and Avila in southern San Luis Obispo County. Historically, much of the seafood caught in this area was landed at Monterey, where the sardine and salmon industries boomed from the late 1800s to the mid-1900s. By 1950, 25 sardine canneries operated along Monterey’s Cannery Row, with and another 14 at Moss Landing. The fishery collapsed shortly thereafter, shifting effort to other fisheries and areas. Commercial ocean salmon fishing is also credited as developing in Monterey Bay. Today, fishermen continue to target coastal pelagic species (anchovy, sardine and squid) and salmon, along with groundfish and other species.
Fishing communities
This region encompasses three counties with five primary port-based fishing communities (listed north to south):
| Santa Cruz County | Monterey County | San Luis Obispo County |
| Santa Cruz | Moss Landing | Morro Bay |
| Monterey | Avila/Port San Luis |
Types of local commercial fisheries
In recent years, the Central Coast region has supported a variety of fisheries, with sablefish, sardine, squid and salmon among the most active. However, the mix of fisheries and level of activity in each port and overall varies as a function of changes in species distribution and availability, regulations, physical infrastructure, market demand, buyers and other factors.
In 2013, commercial fishermen landed more than 53.8 million pounds (24,400 metric tons) of seafood in this region with an ex-vessel value (amount paid to fishermen) of nearly $26 million. The top fisheries (species-gear combinations, listed in alphabetical order) in pounds landed and/or ex-vessel value that year were:
See our regional seafood posters and the commercial fishery landings data (links below) to learn more about the fisheries of this region.
| Ex-Vessel Value (≥ $1 million each) | Pounds landed (≥1 million pounds each) |
|---|---|
| Blackcod (sablefish) hook-and-line, trap, trawl | Blackcod (sablefish) hook-and-line, trap, trawl |
| Dungeness crab pot | Coastal pelagic finfish (anchovy, sardine) seine |
| Groundfish (rockfish, flatfish) hook-and-line, trap, trawl | Groundfish hook-and-line, trap, trawl |
| Market squid seine | Market squid seine |
| Salmon (Chinook or king) troll |
Fisheries seasonality
The chart below shows the times when the major commercial fisheries of the Central Coast region are most active. Other, smaller fisheries, while also important, are not shown here. This chart combines all gear types that target the indicated species. Note that fishing activity does not necessarily start at the beginning or stop at the end of a month, and that the timing and types of fisheries may vary from year to year. (See state and federal commercial fishing regulations for current and specific dates.)
Seasonality of selected Central Coast California fisheries in 2013
The local ocean environment
The Central Coast region's ocean environment is a highly productive upwelling-driven ecosystem that contains many unique features such as:
- Giant kelp forests
- Monterey Submarine Canyon
- Bays and estuaries (e.g., Elkhorn Slough, Morro Bay)
Ocean waters within the region have both soft-bottom (sand and/or mud) and rocky habitats, including pinnacles, outcrops and canyons, with all of them important for certain fisheries. The extent extent of the continental shelf varies: off Big Sur, it is narrow and drops off sharply to deep water, while off Morro Bay, it is broader, with extensive soft-bottom habitat.
One of the most remarkable features in the area that contributes to the high marine biodiversity of the region is the mile-deep Monterey Submarine Canyon, which begins less than 100 yards off the coast near Moss Landing and extends about 95 miles southwest along the ocean floor. The canyon's depth and nutrient flows provide extensive habitat for a remarkable variety of marine life, from deep-sea worms to giant blue whales.
The management context
The region's commercial fisheries are managed by the state through the California Legislature, the Fish and Game Commission and the Department of Fish and Wildlife (CDFW); by the federal government through the Pacific Fishery Management Council (PFMC) and National Marine Fisheries Service (NMFS); or by both (see Management Context for more information). The following table shows which government entity (or entities) has management authority and the management measures used for some of the region’s most active fisheries.
| Fishery | Management Authority | Management Measures | |||||
|---|---|---|---|---|---|---|---|
| State | Federal | Limited entry | Quotas | Time/area closures | Species size/sex rules | Gear restrictions | |
| Albacore troll | ✓ | ✓ | |||||
| Blackcod (sablefish) hook-and-line, trap, trawl | ✓ | ✓ | ✓ | ✓ | ✓ | ✓ | ✓ |
| Coastal pelagic finifish seine | ✓ | ✓ | ✓ | ✓ | ✓ | ✓ | |
| Dungeness crab pot | ✓ | ✓ | ✓ | ✓ | ✓ | ||
| Groundfish hook-and-line, trap, trawl | ✓ | ✓ | ✓ | ✓ | ✓ | ✓ | ✓ |
| Market squid seine | ✓ | ✓ | ✓ | ✓ | ✓ | ||
| Salmon troll | ✓ | ✓ | ✓ | ✓ | ✓ | ✓ | ✓ |
Note: Management authority and/or measures may vary for a given fishery depending on species and/or gear type
Information Sources
- California Marine Life Protection Act Initiative (CA MLPAI). 2005. MLPAI Regional Profile of the Central Coast Study Region (Pigeon Point to Point Conception, CA), September 19, 130 pp.
- Hackett, S. 2002. An Economic Overview of the California Wetfish Industry Complex. In California's "Wetfish" Industry: It's Importance Past, Present and Future, edited by D. Pleschner-Steele. Santa Barbara, CA: California Seafood Council, 65 pp.
- Leet, W.S., Dewees, C.M., Klingbeil, R. and E.J. Larson. 2001. California's Living Marine Resources: A Status Report. 4th ed. Sacramento, CA: CDFG, 562 pp.
- Pomeroy, C., M. Hunter and M. Los Huertos. 2002. Socio-Economic Profile of the California Wetfish Industry. In California's "Wetfish" Industry: It's Importance Past, Present and Future, edited by D. Pleschner-Steele. Santa Barbara, CA: California Seafood Council, 46 pp.
- Pomeroy, C. & M. Dalton. 2005. Market Channels and Value Added to Fish Landed at Monterey Bay Area Ports. Research Final Report, California Sea Grant College Program, 18 pp.
- Pomeroy, C., and M. Dalton. 2003. Socio-Economics of the Moss Landing Commercial Fishing Industry. Report to the Monterey County Office of Economic Development and the Moss Landing Study Steering Committee, 121 pp.
- Pomeroy, C. and M. Stevens. 2008. Santa Cruz Harbor Commercial Fishing Community Profile. California Fishing Communities Project. University of California Sea Grant College Program T-066, San Diego, CA, 34 pp.
- Scofield, W.L. 1954. California Fishing Ports. Fish Bulletin 96. State of California, Department of Fish and Game, Bureau of Marine Fisheries, 159 pp.
- Starr et al. 2002. Trends in Fisheries and Fishery Resources Associated with the Monterey Bay National Marine Sanctuary from 1981-2000. Sea Grant College Program, La Jolla, CA, 156 pp.
CDFW Commercial Landings Information
Monterey Bay National Marine Sanctuary
NMFS Commercial Fisheries Statistics
Pacific States Management Fisheries Commission (PSMFC) Pacific Fisheries Information Network (PacFIN)

Santa Barbara Channel
The Santa Barbara Channel (SBC) region extends from Point Conception in Santa Barbara County south to Point Dume in Ventura County and includes the four Northern Channel Islands. The historic importance of fisheries resources in this area is evident from the activities of the Chumash Indians. Archaeologists have found large 'middens' - remnant piles of a great variety of shells and fish bones - illustrating the significance of seafood to the diet of native peoples long before European settlement. Today, the region provides seafood worldwide, from a diversity of both finfish and shellfish fisheries.
Fishing communities
This region encompasses two counties with four primary port-based fishing communities (listed north to south):
| Santa Barbara County | Ventura County |
| Santa Barbara | Ventura |
| Channel Islands (Oxnard) Harbor | |
| Port Hueneme |
Types of local commercial fisheries
The region supports a variety of fisheries, with squid, lobster, and sea urchin among the most active. Landings vary among the four harbors, with Port Hueneme and Ventura supporting the larger, coastal pelagic species (market squid in particular) purse seine operations, and Santa Barbara and Channel Islands (Oxnard) harbors prmarily serving the smaller dive, trap and trawl operations. The mix of fisheries and level of activity in each port and overall varies as a function of changes in species distribution and availability, market demand, regulations, physical infrastructure, buyers and other factors.
In 2013, commercial fishermen landed more than 111 million pounds (50,350 metric tons) of seafood in this region with an ex-vessel value (amount paid to fishermen) of nearly $50.5 million. The top fisheries (species-gear combinations, in alphabetical order) in terms of pounds landed and/or ex-vessel value included:
See our regional seafood posters and the commercial fishery landings data (links below) to learn more about the fisheries of this region.
| Ex-Vessel Value (≥ $1.4 million each) | Pound Landed (≥ 1.5 million pounds each) |
|---|---|
| Market squid seine | Coastal pelagic finfish (anchovy, sardine) seine |
| Red sea urchin dive | Market squid seine |
| Rock crab trap | Red sea urchin dive |
| Spiny lobster trap | Rock crab trap |
| Spot prawn trap, trawl |
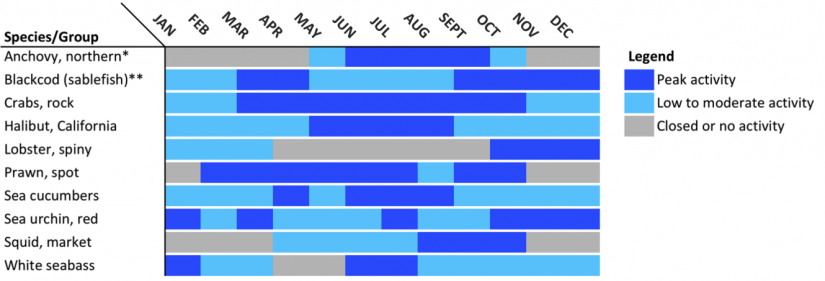
Fisheries seasonality
The chart below shows the times when the major commercial fisheries of the Santa Barbara Channel region are most active. Other smaller fisheries, while also important, are not shown here. This chart combines all gear types that target the indicated species. Note that fishing activity does not necessarily start at the beginning or stop at the end of a month, and that the timing and types of fisheries may vary from year to year. (See state and federal commercial fishing regulations for current and specific dates.)
Seasonality of selected Santa Barbara Channel California fisheries in 2013
The local ocean environment
The Santa Barbara Channel (SBC) region is the northern portion of the Southern California Bight, an area that extends from Point Conception to Baja California in Mexico. A great diversity of fisheries occur in the SBC region due to several key features:
- Oceanographic transition zone
- Strong upwelling zone
- Northern Channel Islands
- Port Hueneme Submarine Canyon
The SBC is a transition zone where the cold waters north of Point Conception mix with the warm waters of Southern California, resulting in a complex system of oceanographic currents and a great diversity of northern and southern ocean species. Upwelling occurs off Point Conception (usually from March through September), providing cold, nutrient-rich waters that move eastward throughout the channel. The region also includes the four Northern Channel Islands – San Miguel, Santa Rosa, Santa Cruz and Anacapa – and associated rocky reefs and kelp forests that are located 12-28 statute miles (19-45 km) off the coast. These islands provide additional habitat for marine life and some protection from southerly storms.
The management context
The region's commercial fisheries are managed by the state through the California Legislature, the Fish and Game Commission and the Department of Fish and Wildlife (CDFW); by the federal government through the Pacific Fishery Management Council (PFMC) and National Marine Fisheries Service (NMFS); or by both (see Management Context for more information). The following table shows which government entity (or entities) has management authority and the management measures used for some of the region’s most active fisheries.
| Fishery | Management Authority | Management Measures | |||||
|---|---|---|---|---|---|---|---|
| State | Federal | Limited entry | Quotas | Time/area closures | Species size/sex rules | Gear restrictions | |
| Blackcod (sablefish) hook-and-line, trap, trawl | ✓ | ✓ | ✓ | ✓ | ✓ | ✓ | ✓ |
| Coastal pelagic finfish seine | ✓ | ✓ | ✓ | ✓ | ✓ | ✓ | |
| Market squid seine | ✓ | ✓ | ✓ | ✓ | ✓ | ||
| Red sea urchin dive | ✓ | ✓ | ✓ | ✓ | ✓ | ||
| Rock crab trap | ✓ | ✓ | ✓ | ✓ | |||
| Sea cucumber dive, trawl | ✓ | ✓ | ✓ | ✓ | |||
| Spiny lobster trap | ✓ | ✓ | ✓ | ✓ | ✓ | ||
| Spot prawn trap | ✓ | ✓ | ✓ | ✓ | |||
Note: Management authority and/or measures may vary for a given fishery depending on species and/or gear type
Information sources
- California Marine Life Protection Act Initiative (CA MLPAI). 2009. CA MLPAI Regional Profile of the South Coast Study Region (Point Conception to the California-Mexico Border), June 25, 193 pp.
- Hackett, S. 2002. An Economic Overview of the California Wetfish Industry Complex. In California's "Wetfish" Industry: It's Importance Past, Present and Future, edited by D. Pleschner-Steele, Santa Barbara, CA: California Seafood Council, 65 pp.
- Leet, W.S., Dewees, C.M., Klingbeil, R. and E.J. Larson. 2001. California's Living Marine Resources: A Status Report. 4th ed. Sacramento, CA: CDFG, 562 pp.
- Pomeroy, C., M. Hunter and M. Los Huertos. 2002. Socio-Economic Profile of the California Wetfish Industry. In California's "Wetfish" Industry: It's Importance Past, Present and Future, edited by D. Pleschner-Steele, Santa Barbara, CA: California Seafood Council, 42 pp.
- San Diego History Center. 2012. TUNA! Celebrating San Diego's Famous Fishing Industry. Museum exhibit, Apr 21-Dec 31.
- CDFW Commercial Landings Information
- NMFS Commercial Fisheries Statistics
- Pacific States Marine Fisheries Commission (PSMFC) Pacific Fisheries Information Network (PacFIN)
- Southern California Ocean Observing System (SCCOOS)
South Coast
The South Coast region includes several fishing communities in Los Angeles, Orange and San Diego counties. Historically, this area was known as the “tuna capital of the world," hosting a large fleet of tuna seiners and tuna-processing canneries, along with a variety of other fisheries. By the early 1980s, most of the canneries had moved offshore (to US territories and other countries). This significant change was due in large part to lower processing costs and the shift of many fishing operations to the western Pacific to avoid conflicts with dolphins and porpoises. Nonetheless, the region’s fishing communities have remained vital due to the continued productivity of the ocean ecosystem, the proximity to large urban centers and extensive port infrastructure, which connect them to domestic and global markets.
Fishing communities
This region encompasses three counties with eleven primary port-based fishing communities (listed north to south):
| Los Angeles County | Orange County | San Diego County |
| Santa Monica | Huntington Harbor | Oceanside |
| San Pedro | Newport Beach | Mission Bay |
| Terminal Island | Dana Point | Point Loma |
| Long Beach | San Diego |
Types of local commercial fisheries
Although the commercial tuna fishery here is much less active than in the past, this region has continued to support a variety of fisheries, with coastal pelagic species (market squid and sardine in particular), spiny lobster and red sea urchin among the most active today. However, the mix of fisheries and level of activity in each port and overall varies as a function of changes in species distribution and availability, market demand, regulations, physical infrastructure, buyers and other factors.
In 2013, commercial fishermen landed more than 117.7 million pounds (53,500 metric tons) of seafood in this region with an ex-vessel value (amount paid to fishermen) of nearly $45.8 million. The top fisheries (species-gear combinations, in alphabetical order) in terms of pounds landed and/or ex-vessel value included:
See our regional seafood posters and the California commercial landings data (links below) to learn more about the fisheries of this region.
| Ex-Vessel Value (≥ $1.5 million each) | Pounds Landed (≥ 500,000 pounds each) |
|---|---|
| Coastal pelagic finfish (anchovy, mackerel, sardine) seine | Coastal pelagic finfish seine |
| Market squid seine | Highly migratory species (shark, swordfish, tuna) gillnet, harpoon |
| Red sea urchin dive | Market squid seine |
| Spiny lobster trap | Red sea urchin dive |
| Spot prawn trap, trawl | Spiny lobster trap |
Fisheries seasonality
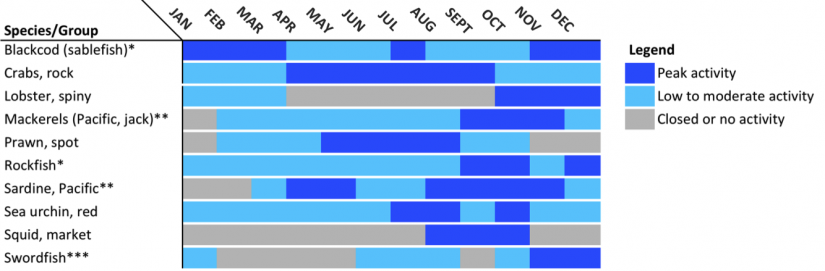
The chart below shows the times of year when the major commercial fisheries of the South Coast region are most active. Other smaller fisheries, while also important, are not shown here. This chart combines all gear types that target the indicated species. Note that fishing activity does not necessarily start at the beginning or stop at the end of a month, and that the timing and types of fisheries may vary from year to year. (See state and federal commercial fishing regulations for current and specific dates.)
Seasonality of selected South Coast California fisheries in 2013

The local ocean environment
The South Coast region encompasses the southern part of the Southern California Bight, which extends from Point Conception in the Santa Barbara Channel region to Baja California in Mexico. Key features of the region include:
- Southern Channel Islands
- Submarine canyons (e.g., La Jolla, Redondo, Point Dume)
- Several bays (e.g., San Pedro, Santa Monica, San Diego)
The four Southern Channel Islands – Santa Barbara, Santa Catalina, San Nicolas and San Clemente – are located about 20-78 miles (32-126 km) offshore from Los Angeles to San Diego. These islands provide habitat for many species, as do the region's coastal bays, enhancing the fisheries of the area.
While coastal geography and wind patterns limit upwelling in the region, several submarine canyons provide nutrient-rich waters to the coast, supporting a diversity of ocean species. The region’s close proximity to sub-tropical waters also adds to its fisheries diversity and productivity, as highly migratory species such as yellowtail and yellowfin tuna often migrate with the warmer water into offshore areas of the region. Temperate species such as albacore and bluefin tuna and swordfish also use these waters during their seasonal migrations.
The management context
The region's commercial fisheries are managed by the state through the California Legislature, the Fish and Game Commission and the Department of Fish and Wildlife (CDFW); by the federal government through the Pacific Fishery Management Council (PFMC) and National Marine Fisheries Service (NMFS); or by both (see Management Context for more information). The following table shows which government entity (or entities) has management authority and the management measures used for some of the region’s most active fisheries.
| Fishery | Management Authority | Management Measures | |||||
|---|---|---|---|---|---|---|---|
| State | Federal | Limited entry | Quotas | Time/area closures | Species size/sex rules | Gear restrictions | |
| Coastal pelagic finfish seine | ✓ | ✓ | ✓ | ✓ | ✓ | ✓ | |
| Market squid seine | ✓ | ✓ | ✓ | ✓ | ✓ | ||
| Red sea urchin dive | ✓ | ✓ | ✓ | ✓ | ✓ | ||
| Spiny lobster trap | ✓ | ✓ | ✓ | ✓ | ✓ | ||
| Spot prawn trap | ✓ | ✓ | ✓ | ✓ | |||
| Swordfish gillnet, harpoon | ✓ | ✓ | ✓ | ✓ | |||
Note: Management authority and/or measures may vary for a given fishery depending on species and/or gear type
Information sources
- California Marine Life Protection Act Initiative (CA MLPAI). 2009. CA MLPAI Regional Profile of the South Coast Study Region (Point Conception to the California-Mexico Border), June 25, 193 pp.
- Hackett, S. 2002. An Economic Overview of the California Wetfish Industry Complex. In California's "Wetfish" Industry: It's Importance Past, Present and Future, edited by D. Pleschner-Steele, Santa Barbara, CA: California Seafood Council, 65 pp.
- Leet, W.S., Dewees, C.M., Klingbeil, R. and E.J. Larson. 2001. California's Living Marine Resources: A Status Report. 4th ed. Sacramento, CA: CDFG, 562 pp.
- Pomeroy, C., M. Hunter and M. Los Huertos. 2002. Socio-Economic Profile of the California Wetfish Industry. In California's "Wetfish" Industry: It's Importance Past, Present and Future, edited by D. Pleschner-Steele, Santa Barbara, CA: California Seafood Council, 42 pp.
- San Diego History Center. 2012. TUNA! Celebrating San Diego's Famous Fishing Industry. Museum exhibit, April 21-December 31.
CDFW Commercial Landings Information
NMFS Commercial Fisheries Statistics
Pacific States Marine Fisheries Commission (PSMFC) Pacific Fisheries Information Network (PacFIN)
Southern California Ocean Observing System (SCCOOS)
Fishing gear and methods
A commercial fishery is typically defined in terms of one or more of the following:
- Species or group of species
- Methods and/or gear used
- Geographic area fished
Examples of commercial fisheries in California include:
- Spiny lobster fishery
- Sea cucumber trawl fishery
- San Francisco Bay herring gillnet fishery
- Southern California rock crab trap fishery
- California sea urchin fishery
- West Coast groundfish fishery
Note that some species may be known by more than one name – for example, blackcod and sablefish.
Fishing Practices
Commercial fishermen use a variety of gear types and methods to catch fish (defined here to include both finfish and shellfish) in California. One or more gear types or methods may be used to catch a given species. For example, rockfish are caught using trap, hook-and-line, and trawl gear, while sea urchins are fished solely by divers.
An individual fisherman uses a specific fishing method depending on:
- Regulations
- Species location and habits
- Individual knowledge and experience
- Vessel size and type
- Market demand, prices and profitability
Regulations specify which gear types and configurations may be used to catch each species, as well as when and where fishing may occur. The overall size and configuration of the vessel determine the type and amount of gear that can be handled and stowed, and how far from shore a fisherman can safely travel. California commercial fishing vessels maybe as small as 10 to 12 feet in length (e.g., skiffs), and are rarely larger than 80 feet, with vessel size related to the locations and conditions fished, the gear used, and the species targeted. And whereas some species are found in a variety of depths and habitats, others tend to occur in particular locations. The size of the hold (where the catch is stored on the boat) and equipment for maintaining quality (e.g., keeping catch alive, onboard freezing) determine how much catch can be carried and how often the fisherman must return to port to offload the catch.
Common Fishing Methods Used in California
Four basic types of commercial fishing gear are used in California:
Dive: Hookah/SCUBA
Hook-and-Line: Longline, Troll, Pole-and-line
Nets: Gillnet, Purse seine, Trawl
Traps: Pots, Traps
The following are general descriptions of these gear types with examples of associated fisheries. For more detailed information on fishing gear, including additional types not described here, please visit the sources provided at the bottom of this page.
Dive
Sea Urchin and Sea Cucumber: Divers using hookah (surface-supplied air gear) or SCUBA (self-contained underwater breathing apparatus) collect urchins using a special tool while sea cucumbers are harvested by hand
Hook-and-Line
The use of hook-and-line gear in California’s commercial fisheries includes a variety of configurations, each appropriate for catching particular species in certain habitats. Hook-and-line fishing methods include longline, troll, pole-and-line, and other related methods. Longline gear consists of a main line with baited hooks attached to shorter lines attached a intervals, withy the gear usually set in place to “soak” for a time to attract the fish. Troll gear includes one or more fishing lines with lures or bait attached, with the lines drawn (“trolled”) through the water to attract the target species, most commonly salmon and albacore. Pole-and-line gear consists of rigid rods or poles with baited lines that are used increasingly by California fishermen to catch white seabass, California halibut, as well as tuna and other species traditionally targeted using this gear.
Longline – groundfish: This gear includes a line that extends horizontally along the sea floor with baited hooks at set intervals along the line. The gear is typically left to soak for 12-24 hours, after which time the gear is retrieved, fish removed and gear redeployed. Targeted species include flounders, soles, rockfish, lingcod, sablefish, and skate, to name just a few.
For some species (e.g., rockfish), vertical longline or more rigid ‘stick’ gear maybe used. The vertical longline is weighted on one end and held vertical by a buoy at the sea surface, with several hooks attached at regular intervals, to better catch fish that may “stack” vertically in the water column. near vertical structures (e.g., around rocky outcrops or canyon walls). Stick gear consists of a length of PVC pipe with leaders attached at intervals along it, each with a hook at the end, to catch bottom or near-bottom species, especially for the live fish market.
Troll – albacore and salmon: Trolling is a hook-and-line fishing method whereby hooks are attached to lines deployed from outriggers (long poles) that extend on each side of the boat and are pulled through the water to attract fish. When albacore fishing, lures are used, the gear is deployed at or near the surface, and the boat travels at high speeds (5 to 8 knots). When trolling for salmon, bait or lures may be used, the gear is deployed at different depths depending on where the fish are, and the vessel moves at slower speeds (less than 3 knots).
Pole-and-Line – albacore tuna, white seabass, California halibut: As the name suggests, this hook-and-line fishing method involves a line with a hook that is attached to a pole. Pole-and-line vessels typically carry live bait which is used to attract the target species. Many fishermen start a fishing trip by catching their own bait, although some buy live bait directly from others who catch it; in both cases, the bait is stored in a “live well” on the boat until it is needed. In southern California, halibut caught using this method may be kept alive in the live well; in other cases, it is packed in ice in the hold or in containers on the deck.
Nets
There are several different types of net fisheries in California, each involving a specific configuration, size and method for its use, to target particular species. Three major types of net gear are used in California: gillnets, purse seines and trawls. The gear used and its specific size and configuration depend on the species targeted, its behavior, and where it is commonly found. Further, for each gear type, the mesh size (the space between knots in the net) differs, and is designed to maximize the catch of the target species while minimizing the catch of undersized and/or non-target species. Thus, a trawl net used to target shrimp differs from one used to target groundfish.
Set Gillnet – barracuda, halibut, herring, white croaker, white seabass: Set gillnets are anchored on the bottom of the ocean, and typically are retrieved within 24 to 48 hours after being set. The mesh size differs for each fishery. For example, California halibut are fished using a net with a minimum mesh size of 8 ½ inches (about 22 cm), whereas white seabass are fished using a net with a minimum mesh size of 6 inches (about 15 cm). Gillnet fishing is only allowed in federal waters (3-200 miles offshore), with a couple of exceptions (e.g., the San Francisco Bay herring fishery).
Drift Gillnet – barracuda, swordfish, thresher shark, white seabass: The drift gillnet is attached to the back of a fishing boat and drifts behind it, below the surface of the ocean. Drift gillnets often are deployed at night and retrieved at dawn. As with set gillnets, the mesh size varies depending on the species fished. Drift gillnet fishing is restricted to certain locations within federal waters; however, permits for this gear are to be phased out by January 2023.
Purse Seine – anchovy, mackerel, sardine, squid, tunas: The purse seine, a type of “roundhaul” gear, is a net that encircles a school of fish or squid. The top of the net has floats or buoys made of cork. The bottom of the net is weighted to hold it in position, and includes a wire cable that is used to draw the net closed, “pursing” the catch. A skiff is used to deploy the net and bring it close to the fishing vessel where fish are pumped (or sometimes scooped) out of the net and into the boat’s fish hold. When fishing for squid, high-intensity lights attached to the purse seine vessel itself or a smaller vessel known as a lightboat, also are used to attract and concentrate the squid so they can be caught in the net.
A trawl is a type of net gear that opens as it is pulled (towed) through the water. The net is funnel-shaped with a closed tail end (cod end) where the fish are collected. The net is equipped with trawl doors, which act as wings, helping to keep the net open horizontally, while a “floatline” on the top and a “footrope” on the bottom of the net create the vertical opening. The nets are towed for various amounts of time, with shorter tows used in some fisheries to increase the likelihood that the catch will remain alive (for specialized live markets) and be in the best possible condition when it’s delivered to the buyer, and to minimize the catch of non-target species.
Bottom Trawl – Groundfish: This trawl gear is used to fish along or near the seafloor (bottom) as described above. The mesh size can be no smaller than 4½ inches (about 11 cm) when fishing groundfish in most areas. However, for trawlers targeting California halibut in state waters, the mesh size must be substantially larger – a minimum of 7½ inches (19 cm). Targeted species include flounders, soles, rockfish, lingcod and skate.
Bottom Trawl – Shrimp: Shrimp trawlers tow single- or double-rig (i.e., one or two) nets near the seafloor. They are similar to groundfish trawls, except the net is usually suspended off the bottom and the minimum mesh size is smaller (1.375 inches (3.5 cm)). A lightweight ‘tickler’ chain, which periodically hits the bottom, is used by some fishermen to get the shrimp off the bottom and into the net. Bycatch reduction devices (BRDs) are required and are incorporated into the nets to make it easier for non-target species to escape.
Midwater (Pelagic) Trawl – Hake (Whiting): Midwater (also known as pelagic) trawls are towed through the water column and have little or no contact with the bottom. They have a minimum mesh size of 3 inches (about 8 cm). This type of trawl requires a vessel with substantial horsepower. Midwater trawls are not used widely in California because the target species, hake, is found primarily off the coast of Oregon and Washington.
Traps
The terms pot and trap are often used interchangeably. However, in California pots tend to be oval or circular, whereas traps are typically rectangular; both may be made of wire and/or plastic. These types of ‘fixed gear’ have an opening (funnel) that is located on the side of the trap, either near the bottom or in the center depending on the target species. They also have an escape port that allows smaller and other non-target animals to exit. Should the trap become lost, a biodegradable ‘destruct device’ will disintegrate, resulting in an opening that allows captured animals to escape. Pots/traps are baited and deployed on the bottom of the ocean at various depths, and are left to ‘soak’ for anywhere from hours to days, depending on the species targeted, weather, and oceanographic conditions. Traps/pots are set separately with a surface buoy marking each trap or in strings with multiple traps tied to a groundline, with an anchor and a buoy at one or both ends.
Pots/Traps – Crabs, lobster, spot prawn, nearshore finfish: Crab pots are used to catch Dungeness crab. Traps are used to catch lobster, spider (sheep) crab, three species of rock crab (relatives of the Dungeness crab), spot prawn and nearshore finfish (e.g., rockfish, lingcod, cabezon). For lobster and crab, the opening (funnel) is located on the side near the bottom so the lobster and crabs can crawl from the ocean bottom into the trap. For spot prawn and nearshore finfish, the funnel is on the side in the center to allow them to swim into the trap. Lobster and crab traps/pots are set in shallower waters (typically < 300 ft/100m), whereas spot prawn traps are set in deeper waters (600-1,080 ft; 180-330 m).
Trap/Pot – Sablefish (blackcod): Sablefish are caught using conical pots or rectangular traps that are larger, heavier, and shaped differently from the other types of trap. The funnel (opening) is in the center along the side of the trap/pot allowing the fish to swim into the trap. This gear is set in water depths averaging about 1,080 ft (330 m).
For additional information on California fishing methods visit:
California's Living Marine Resources
 Carolynn Culver
 Carrie Pomeroy